Question: please don't solve it in excel 3. The data shown in the following table display the results obtained from inspections of a specific part of

please don't solve it in excel please don't solve it in excel 3. The data shown
3. The data shown in the following table display the results obtained from inspections of a specific part of a personal computer. Assume that there are eight samples with size of four. Draw X R control charts for this process. Calculate upper and lower control limits for the charts. Does the process exhibit statistical control? Sample no X3 1 X4 2 2.3 2.3 2 3 4 5 x1 2.3 2.2 3.2 2.8 2.9 1.9 2.3 3.2 Observations x2 2.8 2.5 2.3 2.3 2.5 1.6 3.1 3.3 2.2 2 2.9 2.1 3.5 2.3 2.8 6 1.7 2.3 1.5 2.3 7 8 4,1

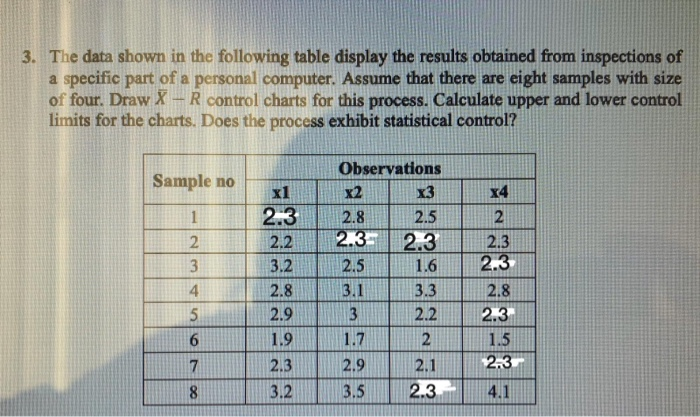
Step by Step Solution

There are 3 Steps involved in it

1 Expert Approved Answer
Step: 1 Unlock blur-text-image
Question Has Been Solved by an Expert!

Get step-by-step solutions from verified subject matter experts

Step: 2 Unlock
Step: 3 Unlock

Students Have Also Explored These Related General Management Questions!