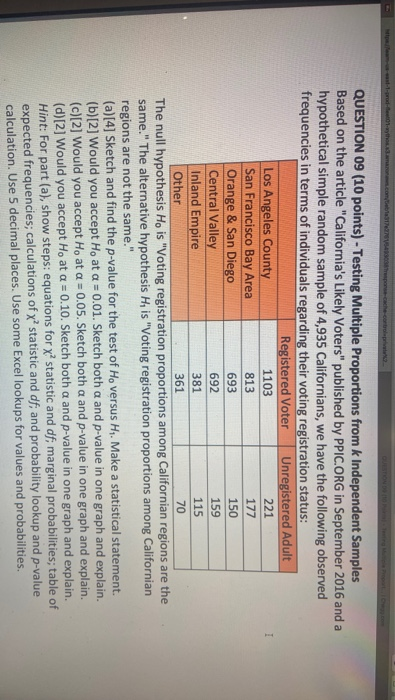
Question: I QUESTION 09 (10 points) - Testing Multiple Proportions from k Independent Samples Based on the article California's Likely Voters published by PPIC.ORG in September

I QUESTION 09 (10 points) - Testing Multiple
I QUESTION 09 (10 points) - Testing Multiple Proportions from k Independent Samples Based on the article "California's Likely Voters" published by PPIC.ORG in September 2016 and a hypothetical simple random sample of 4,935 Californians, we have the following observed frequencies in terms of individuals regarding their voting registration status: Registered Voter Unregistered Adult Los Angeles County 1103 221 San Francisco Bay Area 813 177 Orange & San Diego 693 150 Central Valley 692 159 Inland Empire 381 115 Other 361 70 The null hypothesis Ho is "Voting registration proportions among Californian regions are the same." The alternative hypothesis Hy is "Voting registration proportions among Californian regions are not the same." (a)[4] Sketch and find the p-value for the test of Ho versus H. Make a statistical statement. (b)[2] Would you accept Ho at a = 0.01. Sketch both a and p-value in one graph and explain. (c)[2] Would you accept Ho at a = 0.05. Sketch both a and p-value in one graph and explain. (d) [2] Would you accept Ho at a = 0.10. Sketch both a and p-value in one graph and explain. Hint: For part (a), show steps: equations for x statistic and df; marginal probabilities; table of expected frequencies; calculations of y statistic and df, and probability lookup and p-value calculation. Use 5 decimal places. Use some Excel lookups for values and probabilities

Step by Step Solution

There are 3 Steps involved in it

1 Expert Approved Answer
Step: 1 Unlock blur-text-image
Question Has Been Solved by an Expert!

Get step-by-step solutions from verified subject matter experts

Step: 2 Unlock
Step: 3 Unlock

Students Have Also Explored These Related General Management Questions!