

Question: QUESTION 09 (10 points) - Testing Multiple Proportions from k Independent Samples Based on the article California's Likely Voters published by PPIC.ORG in September 2016
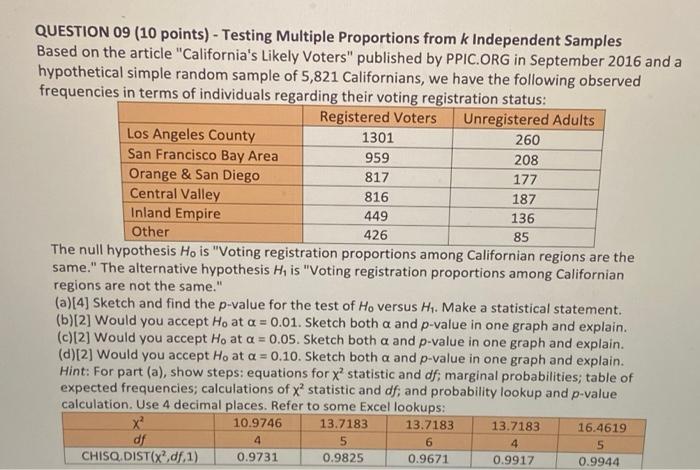
QUESTION 09 (10 points) - Testing Multiple Proportions from k Independent Samples Based on the article "California's Likely Voters" published by PPIC.ORG in September 2016 and a hypothetical simple random sample of 5,821 Californians, we have the following observed frequencies in terms of individuals regarding their voting registration status: The null hypotnesis H0 is "Voting registration proportions among Californian regions are the same." The alternative hypothesis H1 is "Voting registration proportions among Californian regions are not the same." (a) [4] Sketch and find the p-value for the test of H0 versus H1. Make a statistical statement. (b)[2] Would you accept H0 at =0.01. Sketch both and p-value in one graph and explain. (c) [2] Would you accept H0 at =0.05. Sketch both and p-value in one graph and explain. (d)[2] Would you accept H0 at =0.10. Sketch both and p-value in one graph and explain. Hint: For part (a), show steps: equations for x2 statistic and df; marginal probabilities; table of expected frequencies; calculations of 2 statistic and df; and probability lookup and p-value calculation. Use 4 decimal places. Refer to some Excel lookuos
Step by Step Solution
There are 3 Steps involved in it

Get step-by-step solutions from verified subject matter experts