

Question: I ran logistic regression on a dataset and below plots created: Coefficients plot Residuals plot Fitted vs. Observed values plot (using base R) Fitted vs.
I ran logistic regression on a dataset and below plots created:
- Coefficients plot
- Residuals plot
- Fitted vs. Observed values plot (using base R)
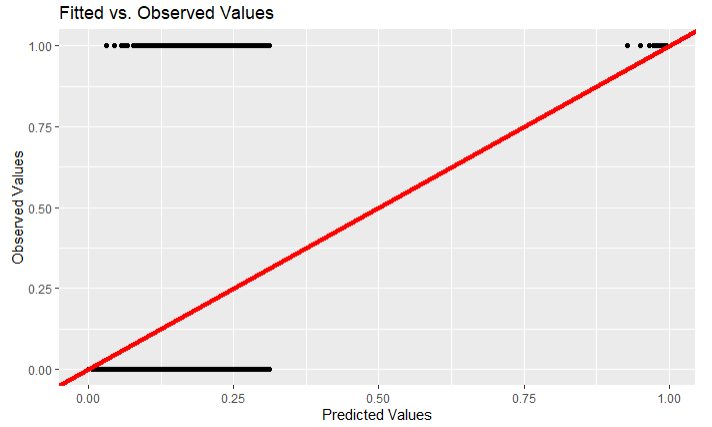
- Fitted vs. Observed values plot (using ggplot2)
Can you please tell me if this a correct model for this dataset based on below outputs? Fitted and Observed values are near to line so i think they are good but want to confirm?
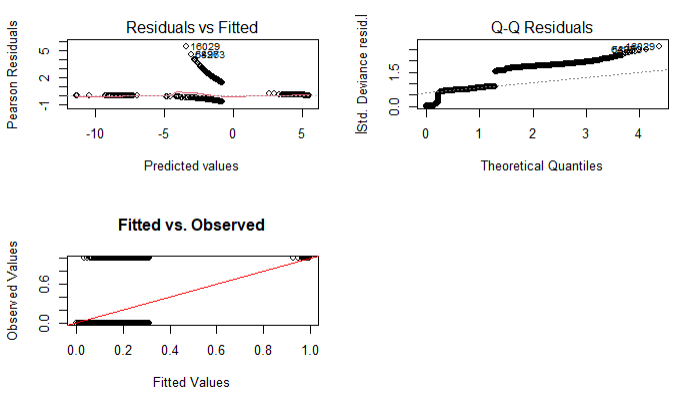
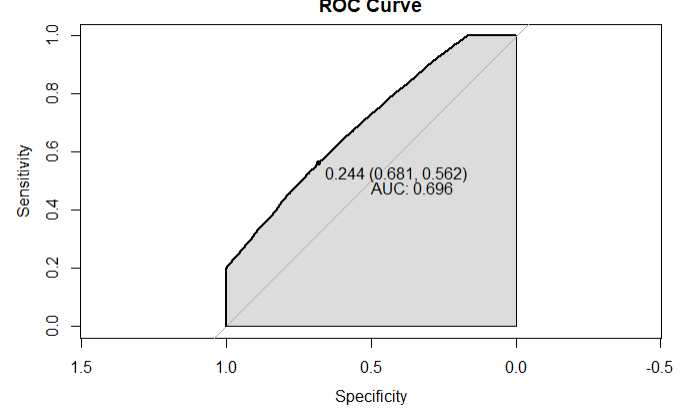
Residuals vs Fitted Q-Q Residuals 016029 and69390 Pearson Residuals IStd. Deviance resid | 0.0 1.5 -1 2 -10 -5 O 5 0 2 4 Predicted values Theoretical Quantiles Fitted vs. Observed Observed Values 0.0 0.6 0.0 0.2 0.4 0.6 0.8 1.0 Fitted ValuesFitted vs. Observed Values 1.00 - 0.75- Observed Values 0,50 - 0.25 - 0.00 - 0.00 0.25 0.50 0.75 1.00 Predicted ValuesROC Curve 1.0 0.8 0.6 Sensitivity 0.244 (0.681, 0.562) AUC: 0.696 0.4 0.2 0.0 1.5 1.0 0.5 0.0 -0.5 Specificity
Step by Step Solution
There are 3 Steps involved in it

Get step-by-step solutions from verified subject matter experts