

Question: I really need help thank you AP statistic homework Clipboard Font G Paragraph les 8. A new regression is created using HITS and HOMERUNS with
I really need help thank you AP statistic homework
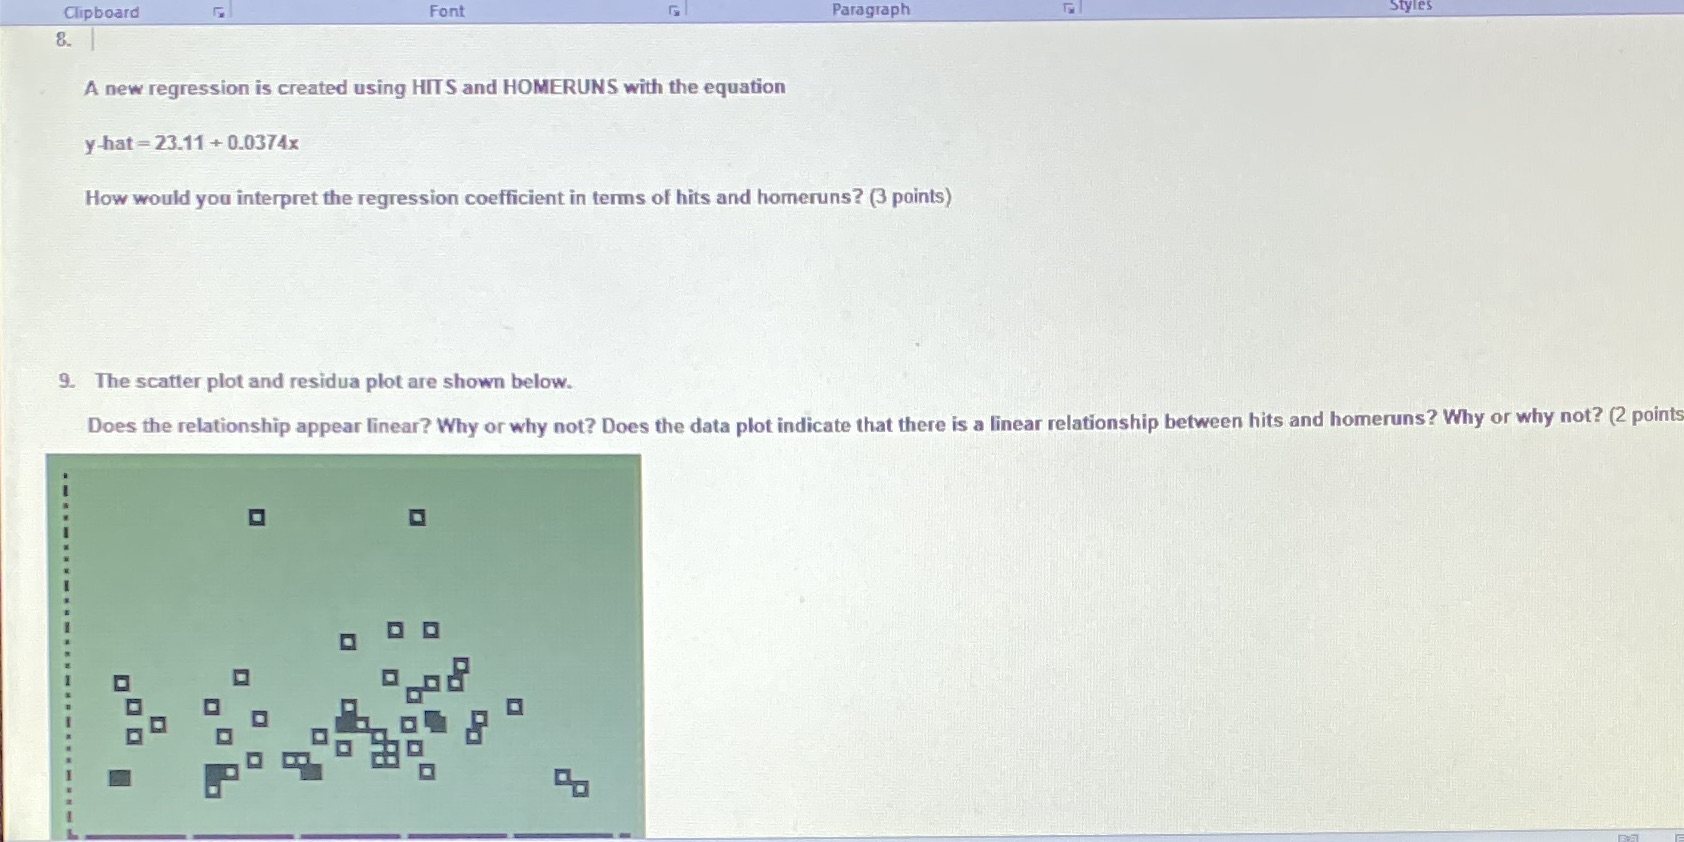
Clipboard Font G Paragraph les 8. A new regression is created using HITS and HOMERUNS with the equation y-hat = 23.11 + 0.0374x How would you interpret the regression coefficient in terms of hits and homeruns? (3 points) 9. The scatter plot and residua plot are shown below. Does the relationship appear linear? Why or why not? Does the data plot indicate that there is a linear relationship between hits and homeruns? Why or why not? (2 points
Step by Step Solution
There are 3 Steps involved in it
1 Expert Approved Answer
Step: 1 Unlock

Question Has Been Solved by an Expert!
Get step-by-step solutions from verified subject matter experts
Step: 2 Unlock
Step: 3 Unlock