

Question: I really need help with this question. It says draw the line of best fit for these data points but have no idea what to
I really need help with this question. It says draw the line of best fit for these data points but have no idea what to do. Where would the line go?
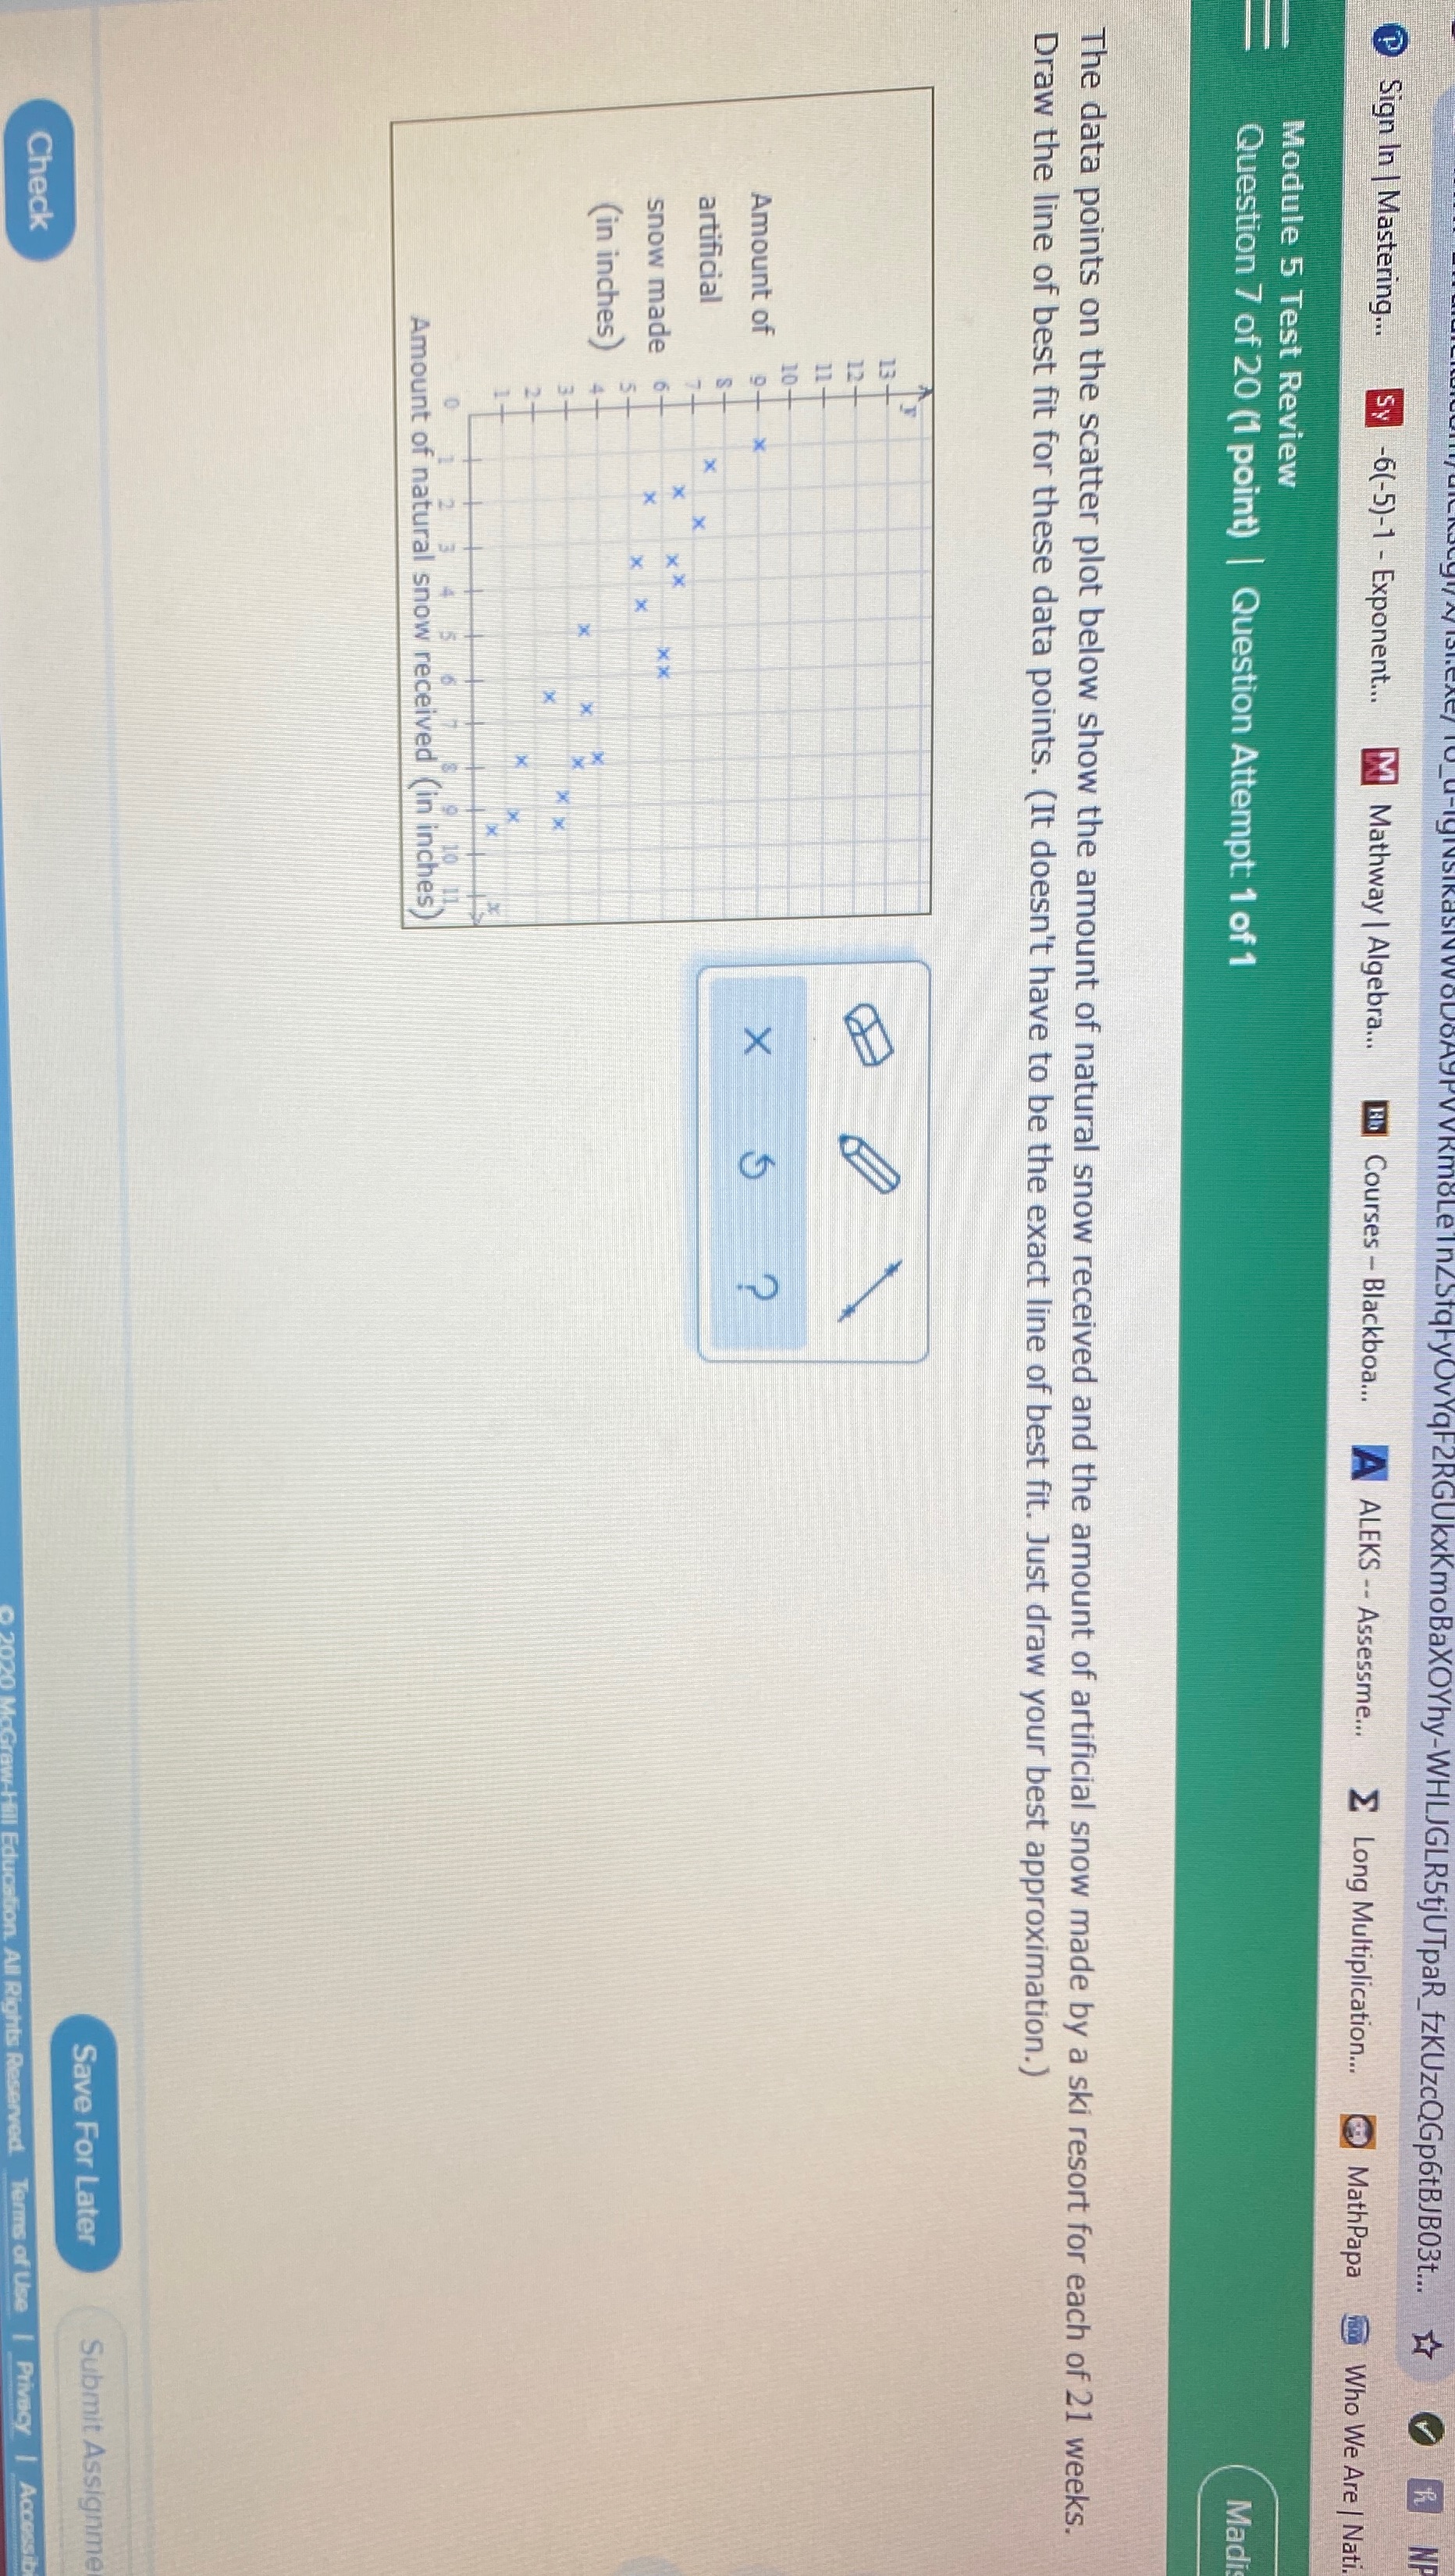
(xKmoBaXOYhy-WHLJGLR5tjUTpaR_fzKUzcQGp6tBJB03t. V Sign In | Mastering. Sy -6(-5)-1 - Exponent... Mathway | Algebra... 13 Courses - Blackboa... A ALEKS -- Assessme. E Long Multiplication. Who We Are | Nati. Module 5 Test Review Question 7 of 20 (1 point) | Question Attempt: 1 of 1 Madi The data points on the scatter plot below show the amount of natural snow received and the amount of artificial snow made by a ski resort for each of 21 weeks. Draw the line of best fit for these data points. (It doesn't have to be the exact line of best fit. Just draw your best approximation.) in Amount of X artificial X X snow made X X (in inches) 0 3 5 Amount of natural snow received (in inches) Save For Later Submit Assignme Check Terms of Use Privacy Accessit
Step by Step Solution
There are 3 Steps involved in it

Get step-by-step solutions from verified subject matter experts