

Question: I really need some help with this. Thanks! Pulley Engineering manufactures needle bearings for use in high-tech machinery. The target diameter for one particular bearing
I really need some help with this. Thanks!
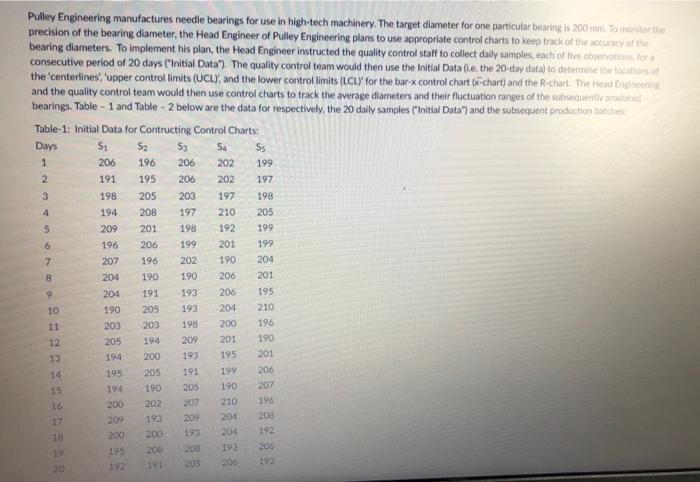
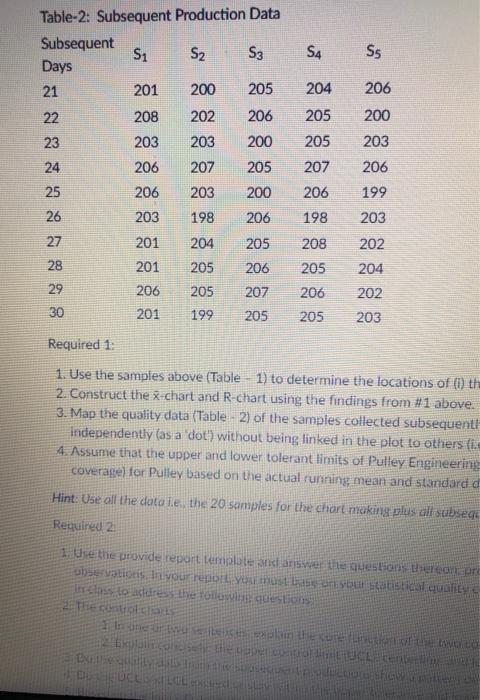
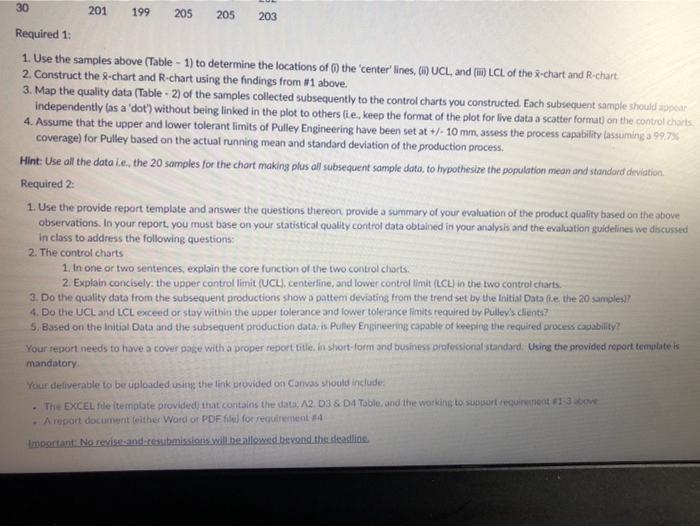
Pulley Engineering manufactures needle bearings for use in high-tech machinery. The target diameter for one particular bearing is 200 mm. To inoriterte precision of the bearing diameter, the Head Engineer of Pulley Engineering plans to use appropriate control charts to keep track of the accuracy of the bearing diameters. To implement his plan, the Head Engineer instructed the quality control staff to collect daily samples, each of five observation for consecutive period of 20 days ("InitialData"). The quality control team would then use the initial Data (e. the 20-day data) to determine the location or the centerlines 'upper controllimits (UCL), and the lower controllimits (LCL) for the bar x control chart chart) and the R-chart. The Header and the quality control team would then use control charts to track the average diameters and their fluctuation ranges of the subsequently produced bearings. Table - 1 and Table - 2 below are the data for respectively, the 20 daily samples ("InitialData") and the subsequent production butches Table-1: Initial Data for Contructing Control Charts: Days S: S2 S3 54 Ss 1 206 196 206 202 199 2 191 195 206 202 197 3 198 205 203 197 198 4 194 208 197 210 205 5 209 201 198 192 199 6 196 206 199 201 199 7 207 196 202 190 204 204 190 190 206 201 204 191 193 206 195 10 190 205 193 204 210 11 203 203 198 200 12 205 194 209 201 190 13 1914 200 193 195 201 195 205 191 199 200 15 194 190 205 190 207 16 200 202 307 210 196 17 209 193 209 204 200 200 200 193 19 195 193 192 200 190 9 196 192 200 S4 SS 204 206 200 205 205 203 Table-2: Subsequent Production Data Subsequent Si S2 S3 Days 21 201 200 205 22 208 202 206 23 203 203 200 24 206 207 205 25 206 203 200 26 203 198 206 27 201 204 205 28 201 205 206 29 206 205 207 30 201 199 205 207 206 199 206 198 203 202 208 205 204 202 206 205 203 Required 1: 1. Use the samples above (Table 1) to determine the locations of (i) the 2. Construct the x-chart and R-chart using the findings from #1 above. 3. Map the quality data (Table 2) of the samples collected subsequenti Independently (as a dot') without being linked in the plot to others i 4. Assume that the upper and lower tolerant limits of Pulley Engineering coverage) for Pulley based on the actual running mean and standard d Hint: Use all the data ie, the 20 samples for the chart making plus all subsega Required 2 1. Use the provide report template and answer the questions thereon pre observations in your report you must be on your statistical quality tehas to address the longestions 2 The cantitats 1 lanet on the Eco Coches Duis DUCE 201 30 199 205 205 203 Required 1: 1. Use the samples above (Table - 1) to determine the locations of (1) the 'center' lines, (IUCL, and (m LCL of the -chart and R-chart 2. Construct the X-chart and R-chart using the findings from #1 above. 3. Map the quality data (Table - 2) of the samples collected subsequently to the control charts you constructed. Each subsequent sample should doar independently (as a 'dot") without being linked in the plot to others lie, keep the format of the plot for live data a scatter format) on the control chorts 4. Assume that the upper and lower tolerant limits of Pulley Engineering have been set at +/- 10 mm, assess the process capability assuming a 99.7% coverage) for Pulley based on the actual running mean and standard deviation of the production process. Hint: Use all the data le, the 20 samples for the chart making plus all subsequent sample data, to hypothesize the population mean and standard deviation. Required 2 1. Use the provide report template and answer the questions thereon provide a summary of your evaluation of the product quality based on the above observations. In your report, you must base on your statistical quality control data obtained in your analysis and the evaluation guidelines we discussed in class to address the following questions: 2. The control charts 1. In one or two sentences, explain the core function of the two control charts. 2. Explain concisely: the upper controllimit (UCL), centerline, and lower controllimit (LCLl in the two control charts. 3. Do the quality data from the subsequent productions show a pattem deviating from the trend set by the Initial Data (e the 20 samples 4. Do the UCL and LCL exceed or stay within the upper tolerance and lower tolerance limits required by Pulley's clients? 5. Based on the Initial Data and the subsequent production data, ts Pulley Engineering capable of keeping the required process coability ? Your report needs to have a cover page with a proper report title. In short form and business professional standard. Using the provided roport templates mandatory Your deliverable to be uploaded using the link provided on Canvas should include The EXCEL de template provided that contains the data, 12. D3 & 4 Table, and the working to support requirement 13 bove A report document either Word or PDF file for requirement 4 Important: No revistadresubmissions will be allowed beyond the deadline
Step by Step Solution
There are 3 Steps involved in it
1 Expert Approved Answer
Step: 1 Unlock

Question Has Been Solved by an Expert!
Get step-by-step solutions from verified subject matter experts
Step: 2 Unlock
Step: 3 Unlock