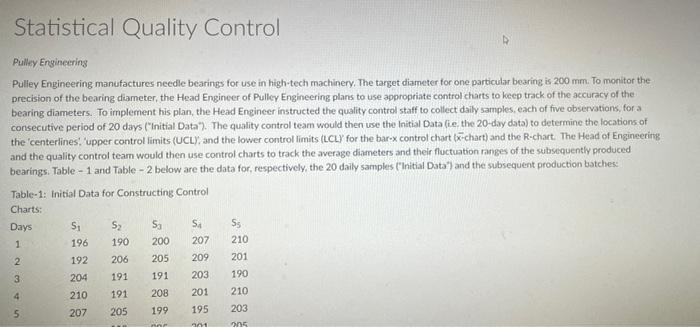
Question: Statistical Quality Control Pulley Engineering Pulley Engineering manufactures needle bearings for use in high-tech machinery. The target diameter for one particular bearing is 200 mm.

Statistical Quality Control Pulley Engineering
Statistical Quality Control Pulley Engineering Pulley Engineering manufactures needle bearings for use in high-tech machinery. The target diameter for one particular bearing is 200 mm. To monitor the precision of the bearing diameter, the Head Engineer of Pulley Engineering plans to use appropriate control charts to keep track of the accuracy of the bearing diameters. To implement his plan, the Head Engineer instructed the quality control staff to collect daily samples, each of five observations, for a consecutive period of 20 days ("InitialData"). The quality control team would then use the initial Data (ie the 20-day data) to determine the locations of the 'centerlines: upper control limits (UCLY, and the lower control limits (LCLY for the bar-x control chart tx chart) and the R-chart. The Head of Engineering and the quality control team would then use control charts to track the average diameters and their fluctuation ranges of the subsequently produced bearings. Table - 1 and Table - 2 below are the data for, respectively, the 20 daily samples ("InitialData") and the subsequent production batches: Table-1: Initial Data for Constructing Control Charts: Days Si S2 53 S Ss 196 190 200 207 210 192 206 205 209 201 3 204 191 191 203 4 191 208 201 210 207 205 199 195 203 1 2 190 210 nor 11 205 Table-1: Initial Data for Constructing Control Charts: Days S2 S3 S4 S1 196 S5 210 1 190 200 207 2 192 206 205 209 201 3 204 191 191 203 190 4 210 191 208 201 210 00 N 5 207 205 199 195 203 6 209 200 205 201 205 7 198 194 195 200 190 8 204 196 204 205 196 9 207 203 206 209 206 10 193 202 193 195 204 11 195 198 190 206 200 12 196 190 193 206 206 13 205 200 208 195 197 14 203 199 201 198 191 15 192 207 197 190 194 16 192 201 196 198 204 17 198 205 195 190 203 18 209 204 197 201 198 19 193 192 195 190 206 20 191 198 206 191 203 Table-2: Subsequent Production Data Subsequent S1 Days 21 203 215 211 S2 S3 SA S5 203 200 22 201 188 186 201 202 23 208 191 199 204 187 24 214 199 206 188 210 25 191 212 202 204 206 26 211 192 191 188 205 27 186 185 214 208 191 28 202 188 200 195 212 29 194 190 214 188 207 30 186 210 206 186 185 194 189 190 210 214 206 30 207 IBS 186 186 Required 1: 1. Use the samples in Table - 1 above, to determine the locations of the center lines, UCL and ( LCL of the X-chart and R.chart. 2. Construct the chart and R-chart using the findings from #1 above. Insert into the x-chart and R-chart additional wrid lines to show where the rio 20. -10, and -20 points locate 3. Map the quality data Table - 27 of the samples collected subsequently to the control charts you comitructed Each subsequent sample should appear Independently in a dot' without beint linked in the plot to others tie, keep the format of the plot for live data a scatter format) on the control charts 4. Assume that the upper and lower tolerant limits of Pulley Engineering how been set at 10 mm, assess the process capability assuming a 99.7% coverage for Pulley based on the actual running man and standard deviation of the production process Hint: Use of the datate, the 20 samples for the chart making plus all subsequent sample sata, to hypothesize the population mean and standard deviation, Required 2: 1. Use the provided report template and answer the questions thereon provide a summary of your evaluation of the product quality based on the above observations. In your report, you must tase on your statistical quality control data obtained in your analysis and the evaluation guidelines we dhcussed in class to address the following questions 2. The control charts 1. In one or two sentences, explain the core function of the x-chart and Richart 2. Explain concisely the upper controllimit (UCL), centerline, and lower controllimit (LCL) in the two control charts 3. Do the quality data from the subsequent productions show a pattam deviating from the trend set by the initial Datafie, the 20 samples? 4. Do the UCL and LCL exceed or stay within the upper tolerance and lower tolerance limits required by Pulleys clients? 5. Based on the initial Data and the subsequent production data is Pulley Engineering capable of keeping their mesanahility

Step by Step Solution

There are 3 Steps involved in it

1 Expert Approved Answer
Step: 1 Unlock blur-text-image
Question Has Been Solved by an Expert!

Get step-by-step solutions from verified subject matter experts

Step: 2 Unlock
Step: 3 Unlock

Students Have Also Explored These Related General Management Questions!