

Question: I run the following code in matlab: close all; clear all; clc; Fs = 8000; recObj = audiorecorder(Fs,8,1); disp('Start speaking:'); keyboard; recordblocking(recObj, 5); disp('End of
I run the following code in matlab:
close all; clear all; clc; Fs = 8000; recObj = audiorecorder(Fs,8,1); disp('Start speaking:'); keyboard; recordblocking(recObj, 5); disp('End of Recording'); myRecording = getaudiodata(recObj); figure, plot(myRecording), title('original time-domain voice recording'); keyboard;
pdFFT = fft(myRecording); figure, plot(abs(pdFFT)), title('abs of fft');
which gives me the following figure:
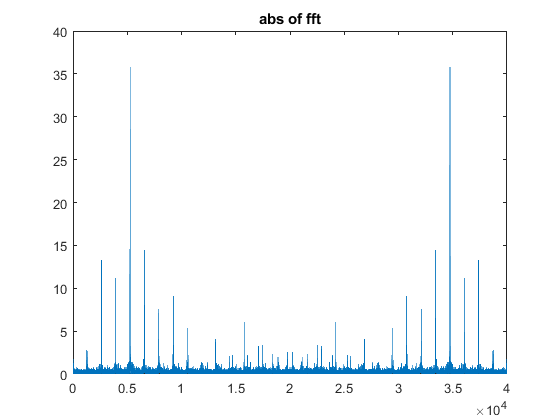
The x-axis corresponds to index number and y-axis to magnitude. I want to add to the above code in order to find the maximum peak of the above graph and then use that index number and convert it to a frequency number and display out the frequency value.
abs of fft 40 35 30 25 20 15 10 5 0.5 1.5 2.5 3.5 4 10
Step by Step Solution
There are 3 Steps involved in it

Get step-by-step solutions from verified subject matter experts