

Question: I started with this code, I want to get the same graph as the question >> x = 0:2*pi/500:2*pi; y = sin(5*x); plot(x,y,'b') Edit MATLAB
I started with this code, I want to get the same graph as the question
>> x = 0:2*pi/500:2*pi;
y = sin(5*x);
plot(x,y,'b')
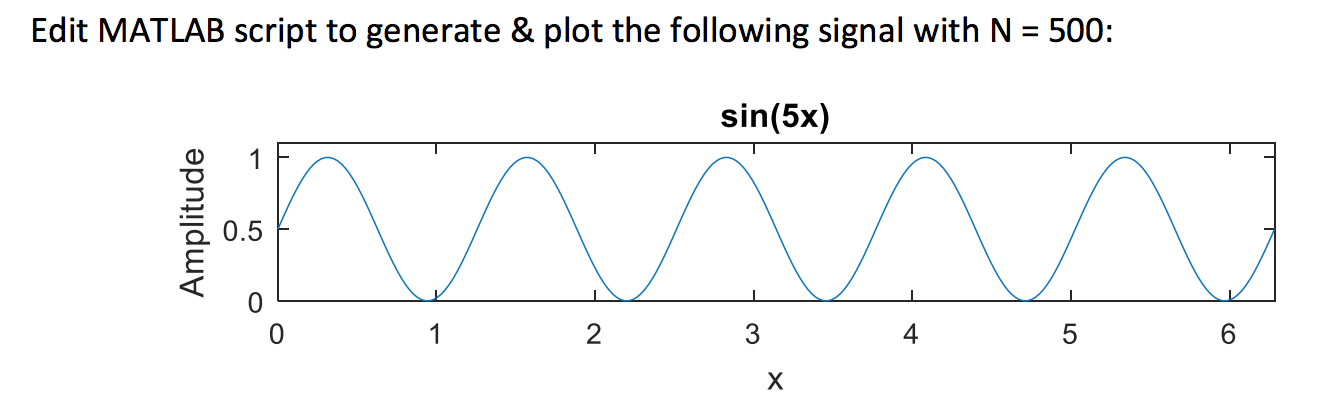
Edit MATLAB script to generate & plot the following signal with N = 500: sin(5x) 0.5 4 6. 5
Step by Step Solution
There are 3 Steps involved in it
1 Expert Approved Answer
Step: 1 Unlock

Question Has Been Solved by an Expert!
Get step-by-step solutions from verified subject matter experts
Step: 2 Unlock
Step: 3 Unlock