

Question: I The chart below shows an hourly load profile over a 2 4 h period. The Y - Axis is average power in kW and
I
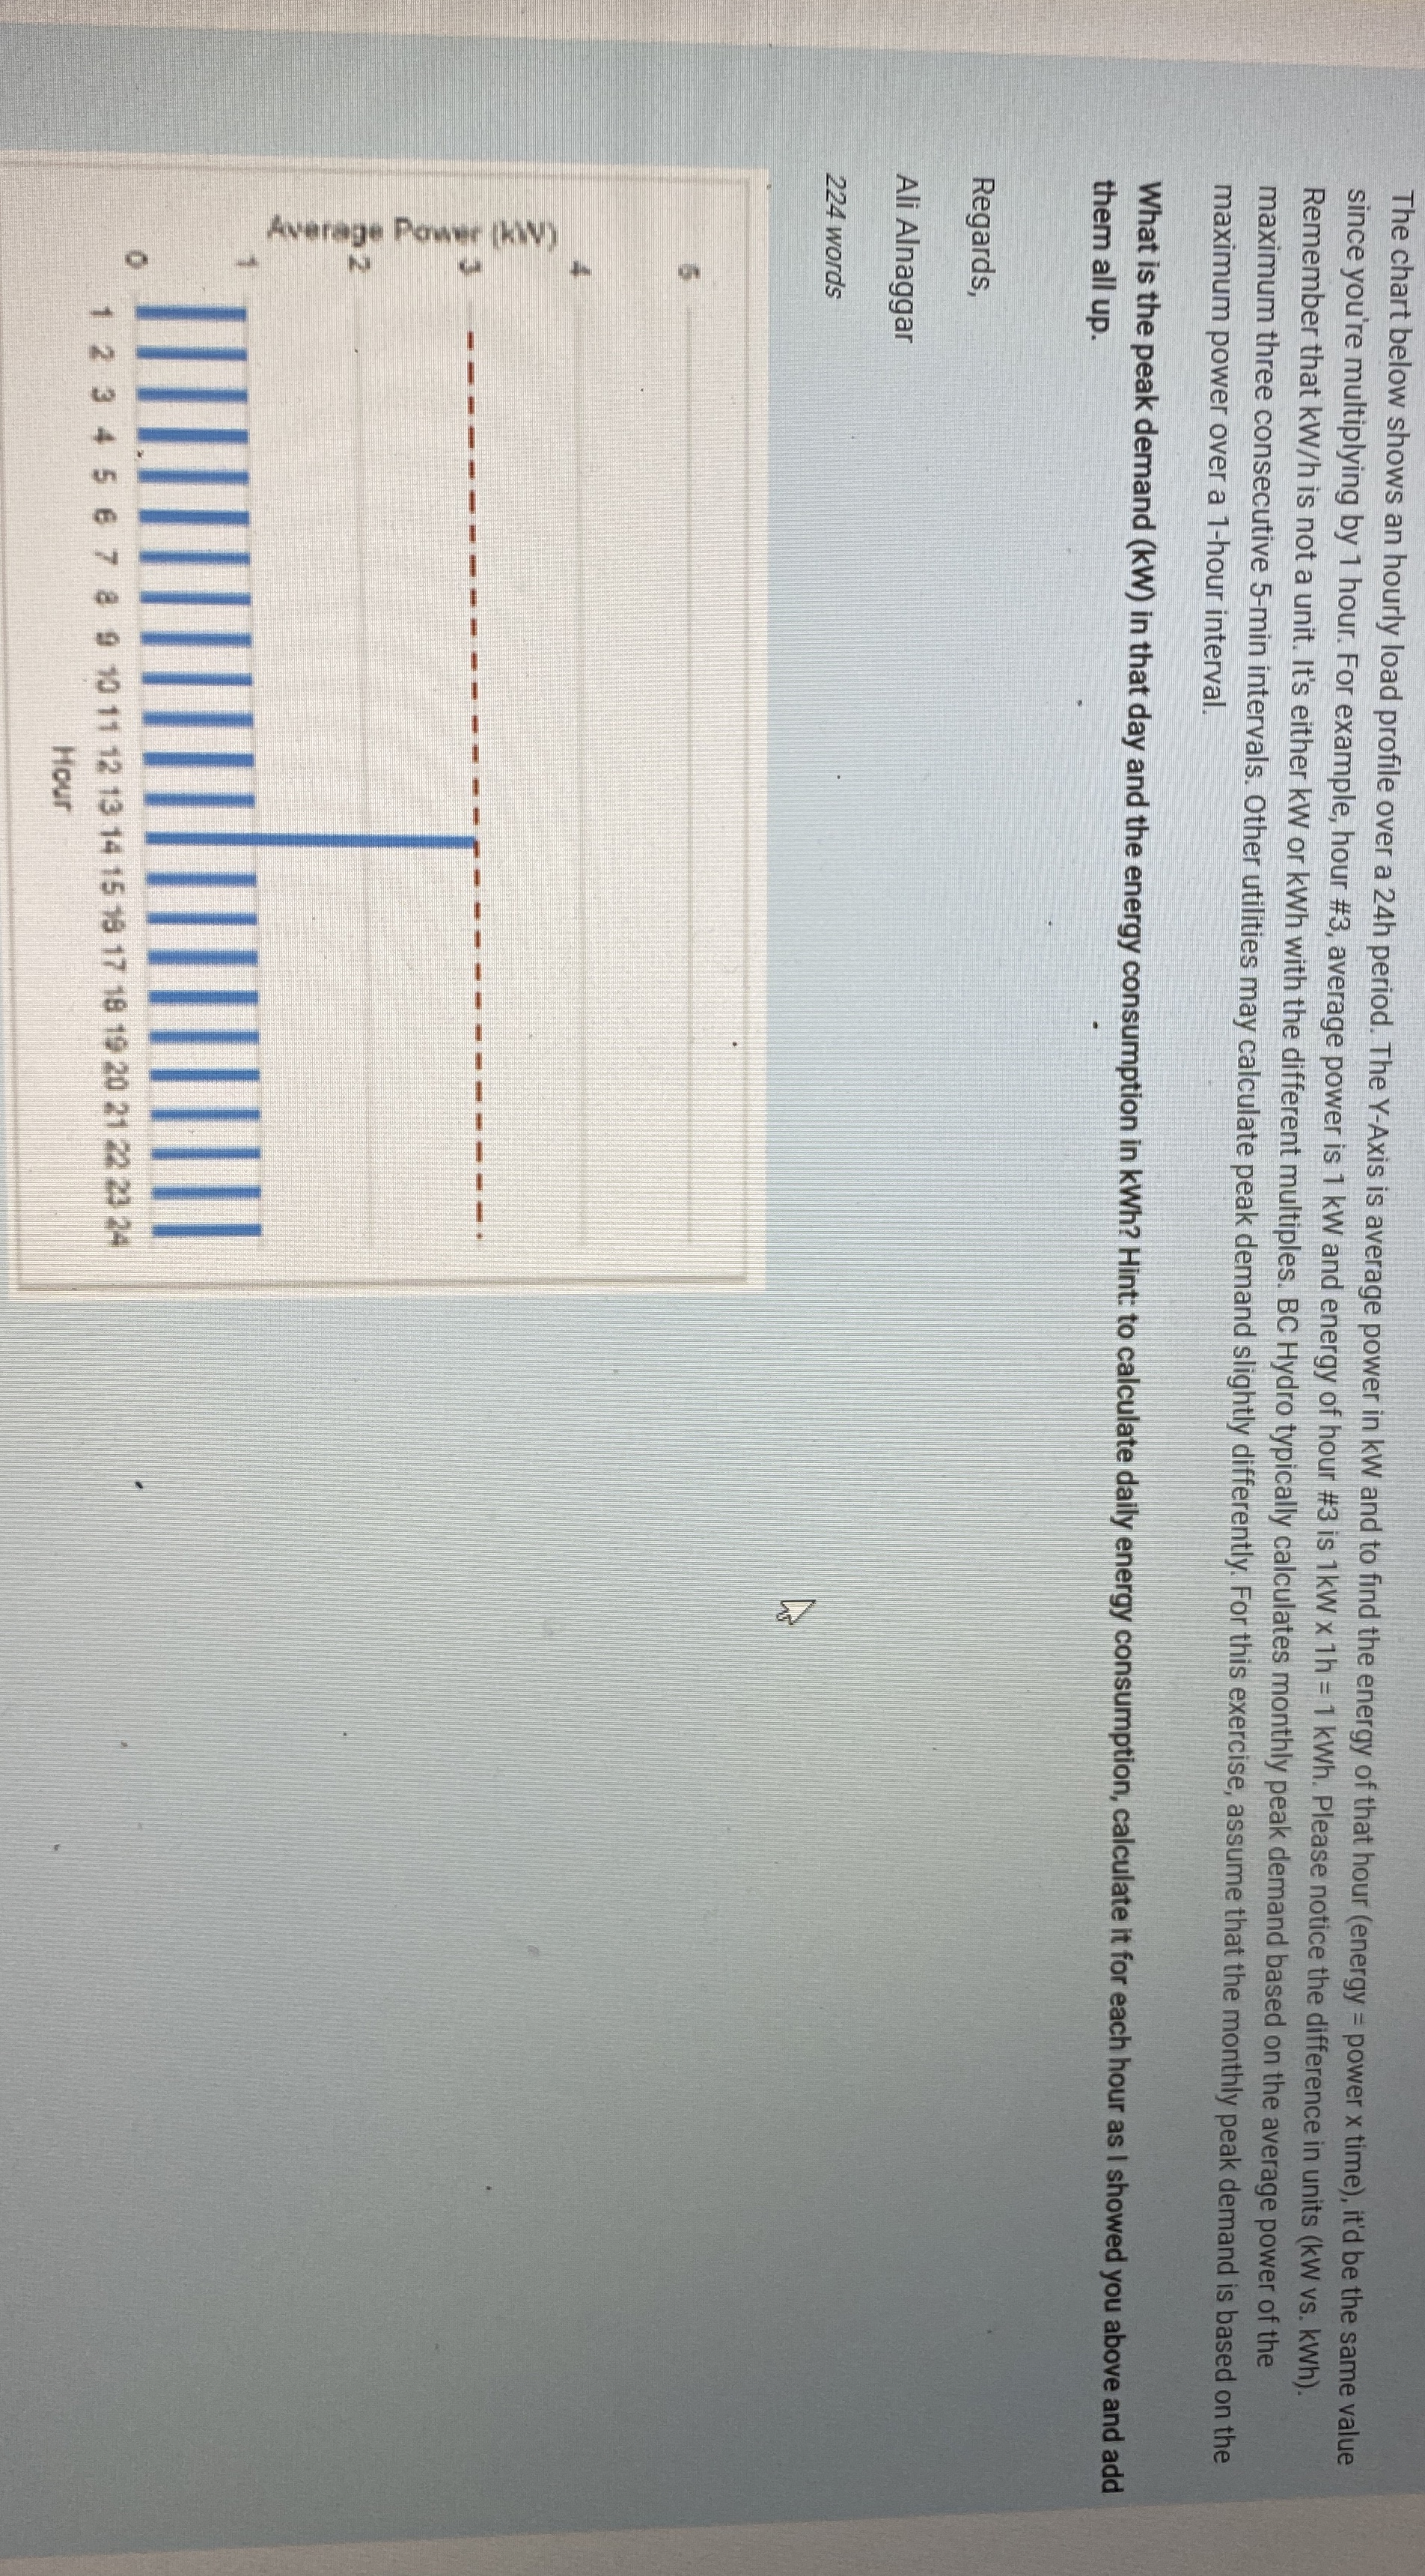
The chart below shows an hourly load profile over a h period. The Y Axis is average power in kW and to find the energy of that hour energy power time it'd be the same value since you're multiplying by hour. For example, hour # average power is kW and energy of hour # is Please notice the difference in units kW vs kWh Remember that kWh is not a unit. It's either KW or kWh with the different multiples. BC Hydro typically calculates monthly peak demand based on the average power of the maximum three consecutive min intervals. Other utilities may calculate peak demand slightly differently. For this exercise, assume that the monthly peak demand is based on the maximum power over a hour interval.
What is the peak demand in that day and the energy consumption in kWh Hint: to calculate daily energy consumption, calculate it for each hour as I showed you above and add them all up
Step by Step Solution
There are 3 Steps involved in it
1 Expert Approved Answer
Step: 1 Unlock

Question Has Been Solved by an Expert!
Get step-by-step solutions from verified subject matter experts
Step: 2 Unlock
Step: 3 Unlock