

Question: I. Visualizing the data The table below shows the life expectancy at birth, by gender, for the years indicated, beginning in 1900 and continuing
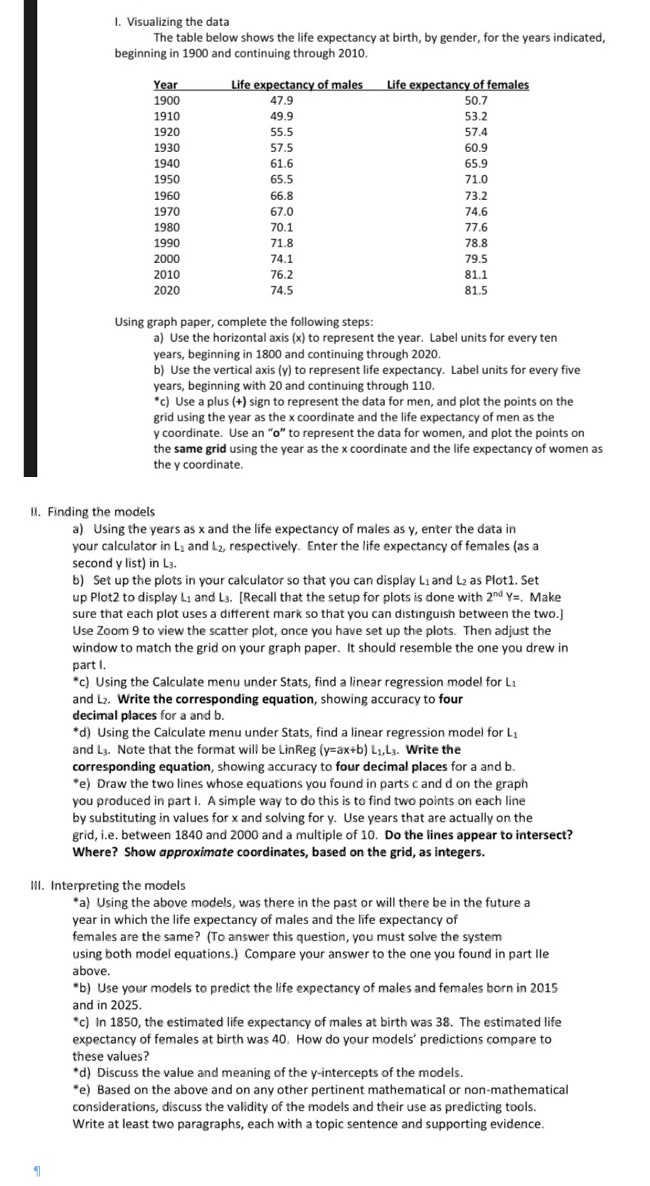
I. Visualizing the data The table below shows the life expectancy at birth, by gender, for the years indicated, beginning in 1900 and continuing through 2010. Year 1900 Life expectancy of males Life expectancy of females 47.9 50.7 1910 49.9 53.2 1920 55.5 57.4 1930 57.5 60.9 1940 61.6 65.9 1950 65.5 71.0 1960 66.8 73.2 1970 67.0 74.6 1980 70.1 77.6 1990 71.8 78.8 2000 74.1 79.5 2010 76.2 81.1 2020 74.5 81.5 Using graph paper, complete the following steps: a) Use the horizontal axis (x) to represent the year. Label units for every ten years, beginning in 1800 and continuing through 2020. b) Use the vertical axis (y) to represent life expectancy. Label units for every five years, beginning with 20 and continuing through 110. *c) Use a plus (+) sign to represent the data for men, and plot the points on the grid using the year as the x coordinate and the life expectancy of men as the y coordinate. Use an "o" to represent the data for women, and plot the points on the same grid using the year as the x coordinate and the life expectancy of women as the y coordinate. II. Finding the models a) Using the years as x and the life expectancy of males as y, enter the data in your calculator in L and L, respectively. Enter the life expectancy of females (as a second y list) in L3. b) Set up the plots in your calculator so that you can display L1 and L2 as Plot1. Set up Plot2 to display L and L3. [Recall that the setup for plots is done with 2nd Y. Make sure that each plot uses a different mark so that you can distinguish between the two.] Use Zoom 9 to view the scatter plot, once you have set up the plots. Then adjust the window to match the grid on your graph paper. It should resemble the one you drew in part I. *c) Using the Calculate menu under Stats, find a linear regression model for L and L2. Write the corresponding equation, showing accuracy to four decimal places for a and b. *d) Using the Calculate menu under Stats, find a linear regression model for L and L3. Note that the format will be Lin Reg (y-ax+b) L,Ls. Write the corresponding equation, showing accuracy to four decimal places for a and b. *e) Draw the two lines whose equations you found in parts c and d on the graph you produced in part I. A simple way to do this is to find two points on each line by substituting in values for x and solving for y. Use years that are actually on the grid, i.e. between 1840 and 2000 and a multiple of 10. Do the lines appear to intersect? Where? Show approximate coordinates, based on the grid, as integers. III. Interpreting the models *a) Using the above models, was there in the past or will there be in the future a year in which the life expectancy of males and the life expectancy of females are the same? (To answer this question, you must solve the system using both model equations.) Compare your answer to the one you found in part lle above. *b) Use your models to predict the life expectancy of males and females born in 2015 and in 2025. *c) In 1850, the estimated life expectancy of males at birth was 38. The estimated life expectancy of females at birth was 40. How do your models' predictions compare to these values? *d) Discuss the value and meaning of the y-intercepts of the models. *e) Based on the above and on any other pertinent mathematical or non-mathematical considerations, discuss the validity of the models and their use as predicting tools. Write at least two paragraphs, each with a topic sentence and supporting evidence.
Step by Step Solution
3.54 Rating (157 Votes )
There are 3 Steps involved in it
I Visualizing the Data a Setting Up the Axes Horizontal Axis x Represent years from 1800 to 2020 Label every ten years eg 1800 1810 2020 Vertical Axis y Represent life expectancy from 20 to 110 Label ... View full answer

Get step-by-step solutions from verified subject matter experts