

Question: I want cude to plot like this figure? Experiment: The Transition to Chaos 75 Orbit fills an interval 4-cycle 2-cycle Fixed Point FIGURE 6.15 The
I want cude to plot like this figure?
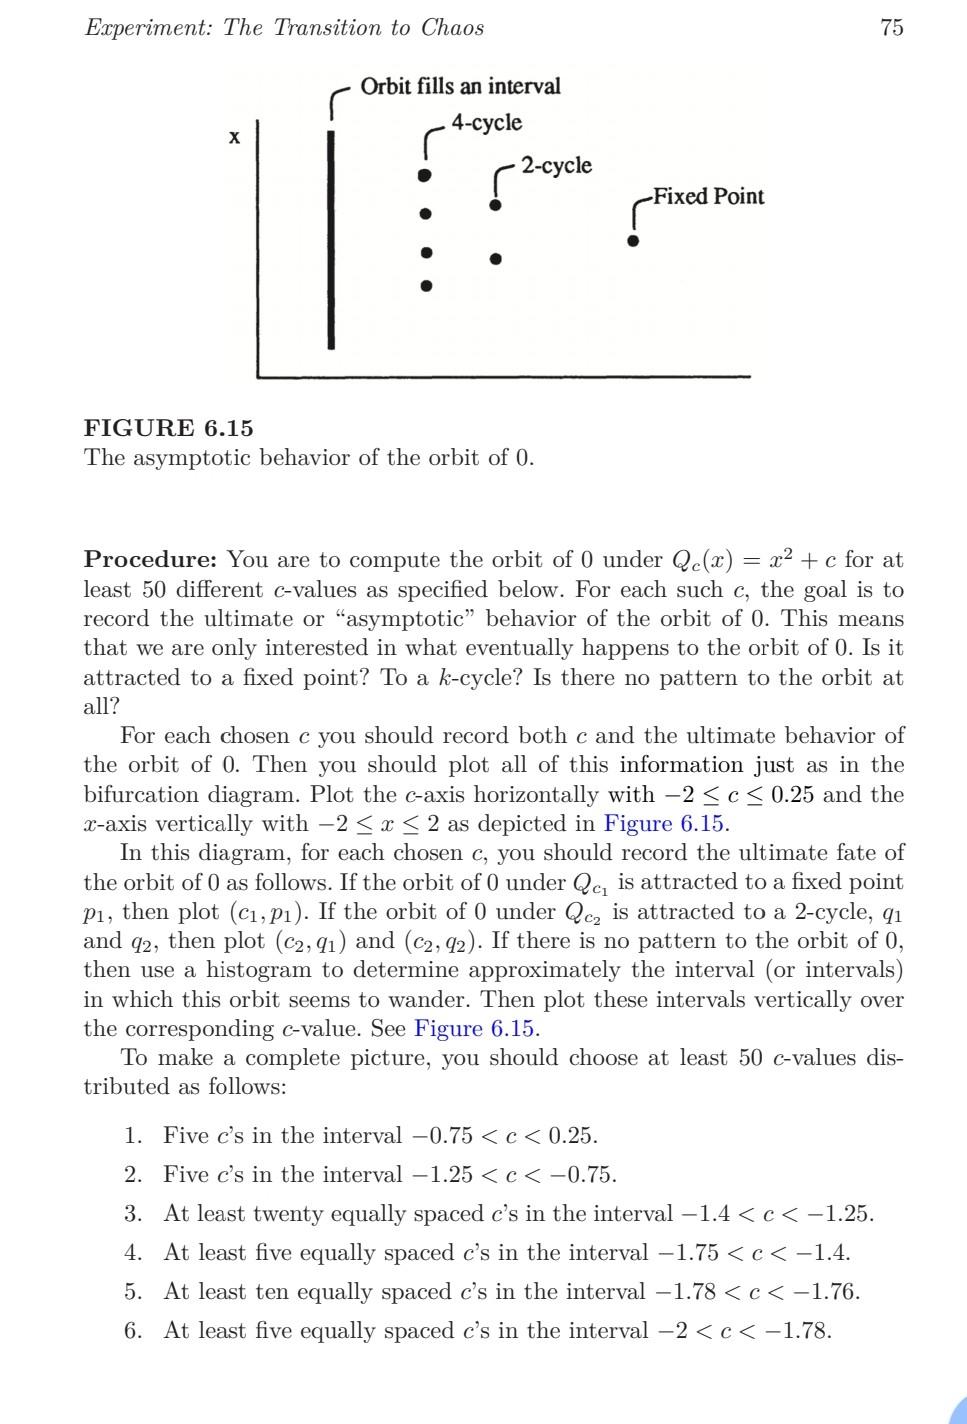
Experiment: The Transition to Chaos 75 Orbit fills an interval 4-cycle 2-cycle Fixed Point FIGURE 6.15 The asymptotic behavior of the orbit of 0. Procedure: You are to compute the orbit of 0 under Qc(2) 22 + c for at least 50 different c-values as specified below. For each such c, the goal is to record the ultimate or asymptotic behavior of the orbit of 0. This means that we are only interested in what eventually happens to the orbit of 0. Is it attracted to a fixed point? To a k-cycle? Is there no pattern to the orbit at all? For each chosen c you should record both c and the ultimate behavior of the orbit of 0. Then you should plot all of this information just as in the bifurcation diagram. Plot the c-axis horizontally with -2
Step by Step Solution
There are 3 Steps involved in it

Get step-by-step solutions from verified subject matter experts