

Question: You are to create a Python code that will plot contours and line plots of the following function. f(x) = A sin(nitx) + B sin
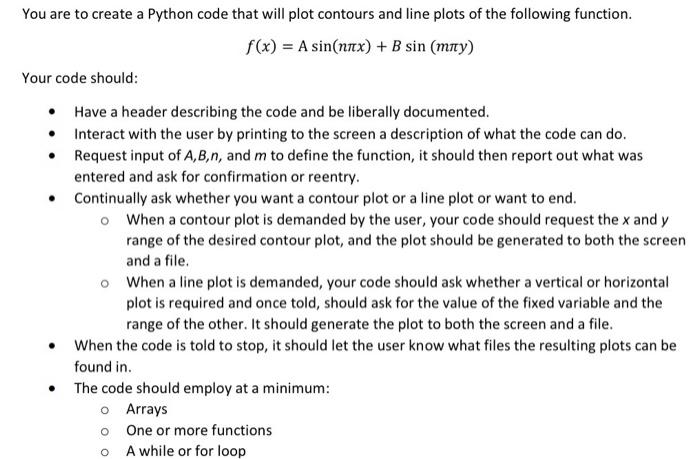
You are to create a Python code that will plot contours and line plots of the following function. f(x) = A sin(nitx) + B sin (mity) Your code should: Have a header describing the code and be liberally documented. Interact with the user by printing to the screen a description of what the code can do. Request input of A,B,n, and m to define the function, it should then report out what was entered and ask for confirmation or reentry. Continually ask whether you want a contour plot or a line plot or want to end. o When a contour plot is demanded by the user, your code should request the x and y range of the desired contour plot, and the plot should be generated to both the screen and a file. o When a line plot is demanded, your code should ask whether a vertical or horizontal plot is required and once told, should ask for the value of the fixed variable and the range of the other. It should generate the plot to both the screen and a file. When the code is told to stop, it should let the user know what files the resulting plots can be found in The code should employ at a minimum: Arrays o One or more functions O A while or for loop You are to create a Python code that will plot contours and line plots of the following function. f(x) = A sin(nitx) + B sin (mity) Your code should: Have a header describing the code and be liberally documented. Interact with the user by printing to the screen a description of what the code can do. Request input of A,B,n, and m to define the function, it should then report out what was entered and ask for confirmation or reentry. Continually ask whether you want a contour plot or a line plot or want to end. o When a contour plot is demanded by the user, your code should request the x and y range of the desired contour plot, and the plot should be generated to both the screen and a file. o When a line plot is demanded, your code should ask whether a vertical or horizontal plot is required and once told, should ask for the value of the fixed variable and the range of the other. It should generate the plot to both the screen and a file. When the code is told to stop, it should let the user know what files the resulting plots can be found in The code should employ at a minimum: Arrays o One or more functions O A while or for loop
Step by Step Solution
There are 3 Steps involved in it

Get step-by-step solutions from verified subject matter experts