

Question: I want to know the Test statistics And p-Value Homework Section 6.5 Question 7 of 8 0.33 /1 E View Policies Show Attempt History Current
I want to know the Test statistics And p-Value
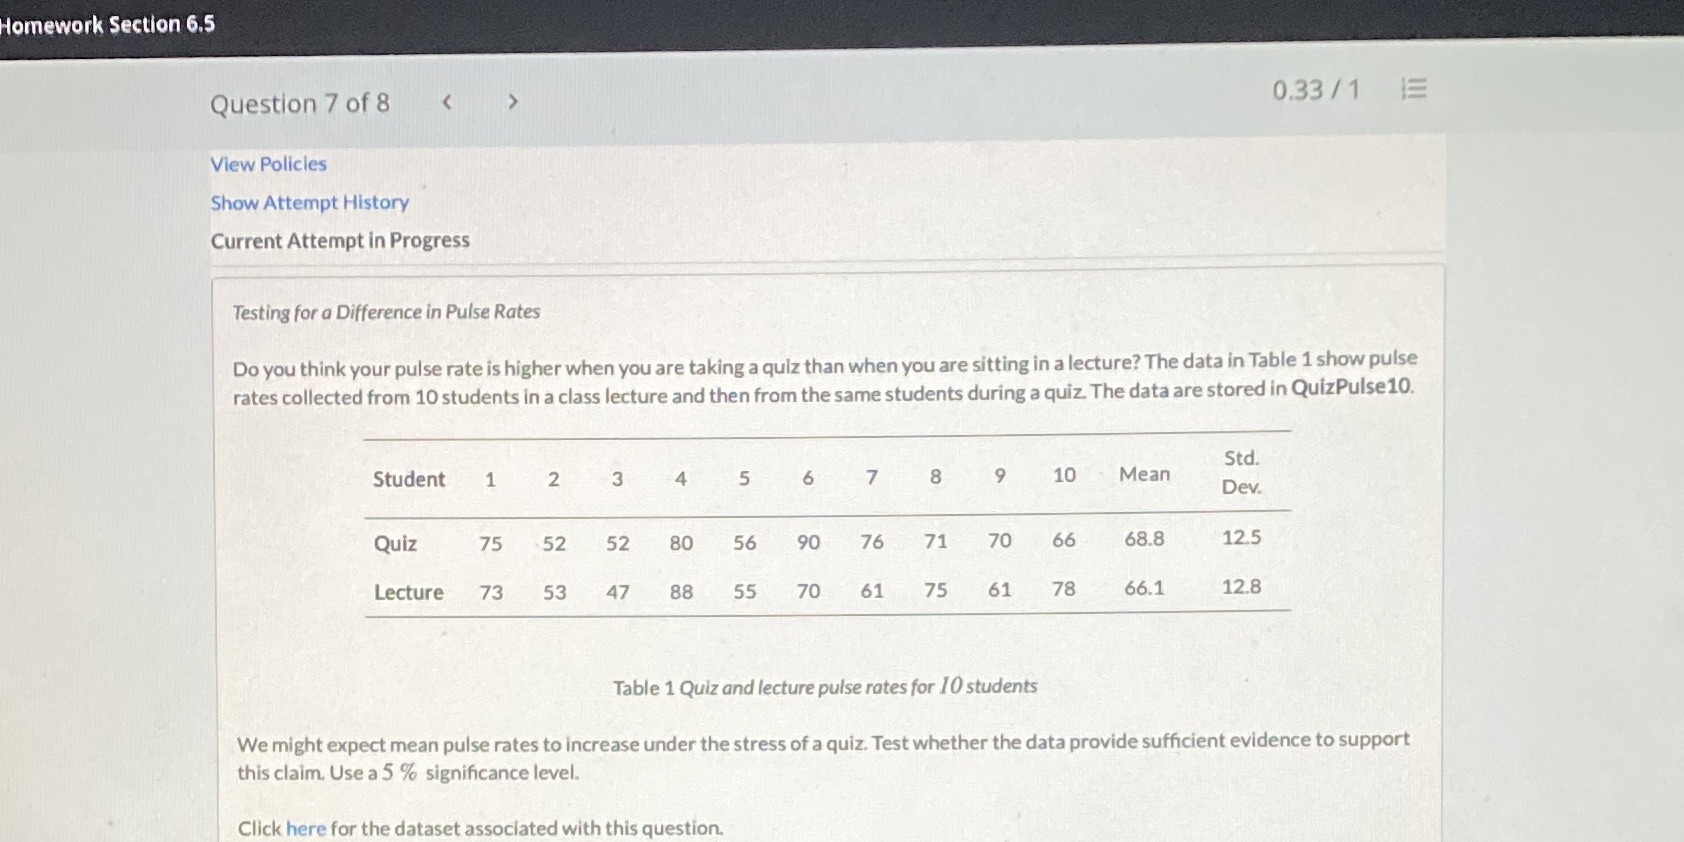
Homework Section 6.5 Question 7 of 8 0.33 /1 E View Policies Show Attempt History Current Attempt in Progress Testing for a Difference in Pulse Rates Do you think your pulse rate is higher when you are taking a quiz than when you are sitting in a lecture? The data in Table 1 show pulse rates collected from 10 students in a class lecture and then from the same students during a quiz. The data are stored in QuizPulse10. Std. Student 1 2 3 4 5 6 7 8 9 10 Mean Dev. Quiz 75 52 52 80 56 90 71 70 66 68.8 12.5 Lecture 73 53 47 88 55 70 61 75 61 78 66.1 12.8 Table 1 Quiz and lecture pulse rates for 10 students We might expect mean pulse rates to increase under the stress of a quiz. Test whether the data provide sufficient evidence to support this claim. Use a 5 % significance level. Click here for the dataset associated with this
Step by Step Solution
There are 3 Steps involved in it

Get step-by-step solutions from verified subject matter experts