

Question: I want to make a plot in MATLAB, the y axis has repeated numbers (1,2,3,4,5,6). I want to set a name for each number to
I want to make a plot in MATLAB, the y axis has repeated numbers (1,2,3,4,5,6). I want to set a name for each number to appear in the graph. How can I make it fixed.
example: 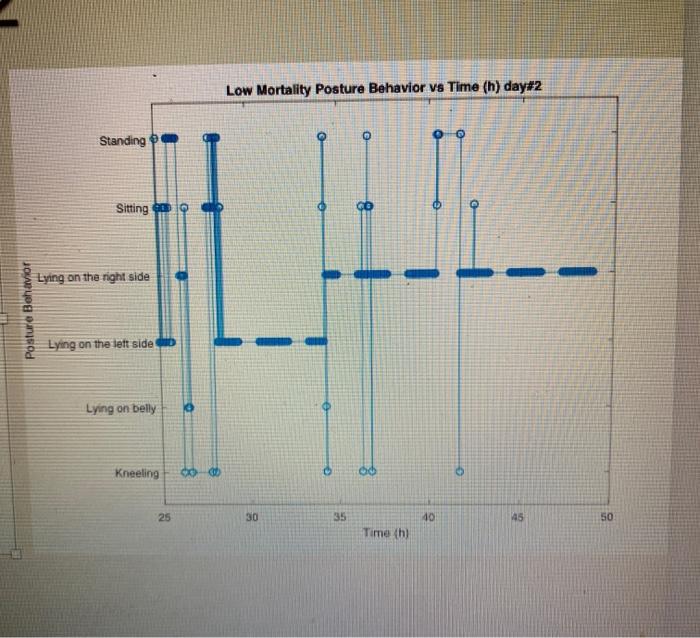
Low Mortality Posture Behavior vs Time (h) day#2 Standing Sittingen Lying on the right side Posture Behavior Lying on the left side Lying on belly Kneeling 25 30 35 40 45 50 Time {h)
Step by Step Solution
There are 3 Steps involved in it
1 Expert Approved Answer
Step: 1 Unlock

Question Has Been Solved by an Expert!
Get step-by-step solutions from verified subject matter experts
Step: 2 Unlock
Step: 3 Unlock