

Question: I want to plot ( Cp, ) in matlab ( like the graph below) . what is step? where The coefficients c 1 to c
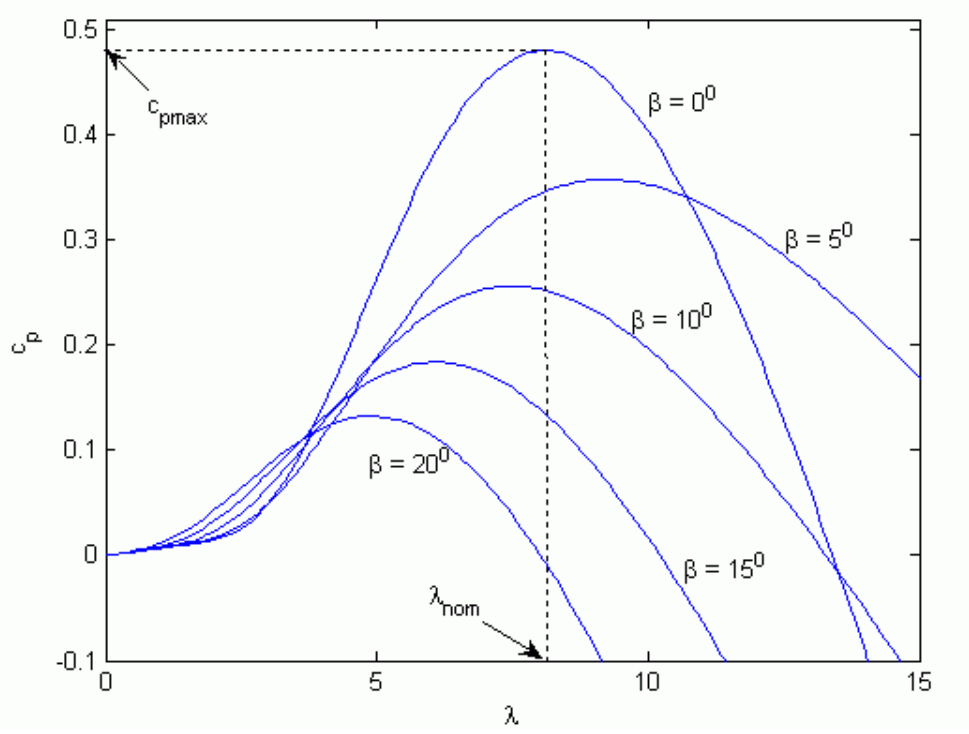
I want to plot ( Cp,  ) in matlab ( like the graph below) . what is step?
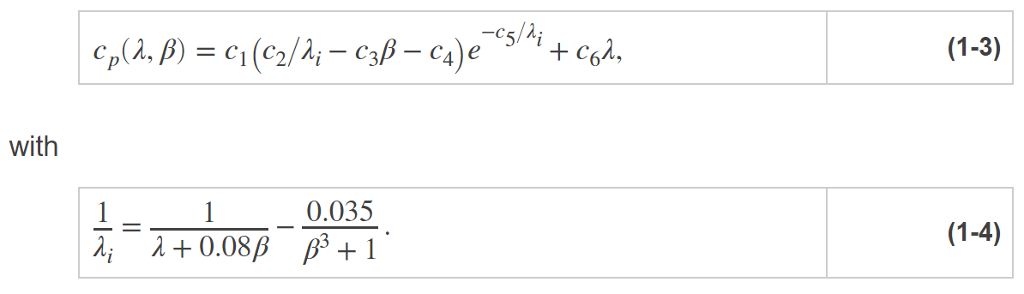
where
The coefficients c1 to c6 are: c1 = 0.5176, c2 = 116, c3 = 0.4, c4 = 5, c5 = 21 and c6 = 0.0068
 = 0o 1o , 2o.............15
Step by Step Solution
There are 3 Steps involved in it
1 Expert Approved Answer
Step: 1 Unlock

Question Has Been Solved by an Expert!
Get step-by-step solutions from verified subject matter experts
Step: 2 Unlock
Step: 3 Unlock