

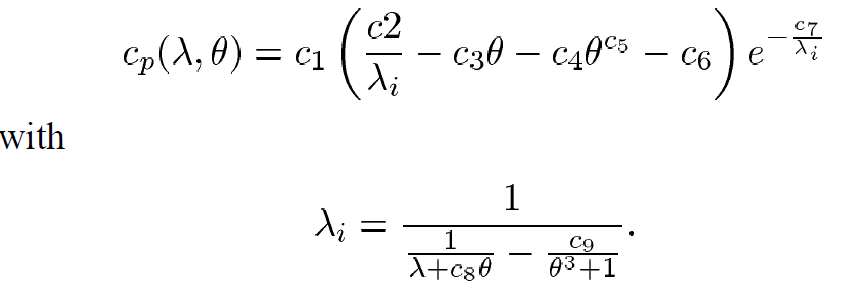
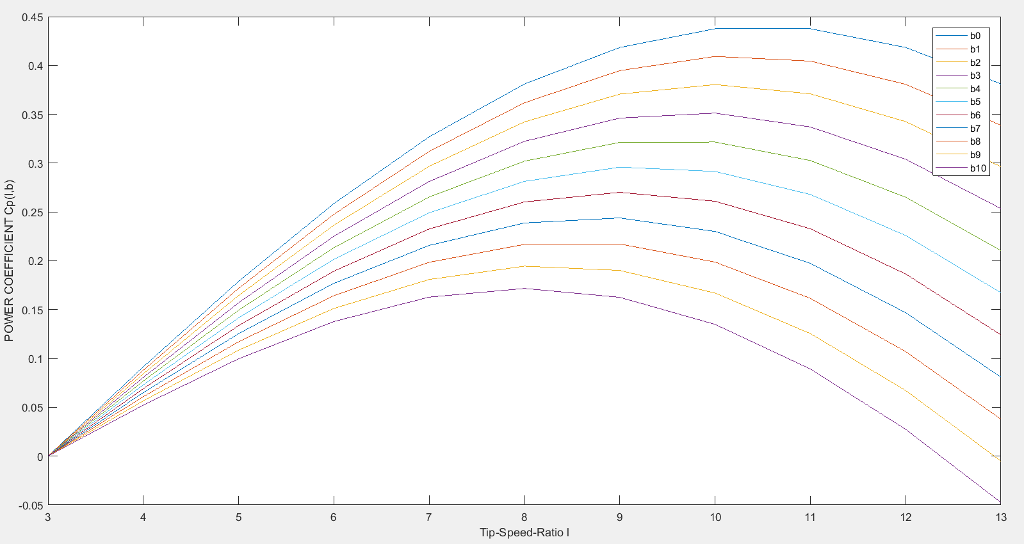
Question: I want to plot ( Cp, ) in matlab ( like the graph below) . what is step? where C1= 0.73 , C2= 151 ,
I want to plot ( Cp,  ) in matlab ( like the graph below) . what is step?
where
C1=0.73 , C2= 151 , C3= 0.58 , C4=0.002 , C5=2.14 ,C6=13.2 , C7=18.4 , C8 = -0.02 , C9= 0.003
 = 0o 1o , 2o.............15o and
  = 2, 3, 4, ...........13
Step by Step Solution
There are 3 Steps involved in it
1 Expert Approved Answer
Step: 1 Unlock

Question Has Been Solved by an Expert!
Get step-by-step solutions from verified subject matter experts
Step: 2 Unlock
Step: 3 Unlock