

Question: I was able to find the average return and volatility for each stock but I can't figure out the standard deviation for each, my answer
I was able to find the average return and volatility for each stock but I can't figure out the standard deviation for each, my answer was wrong. Can you also help me find parts B and C?
Thank you!

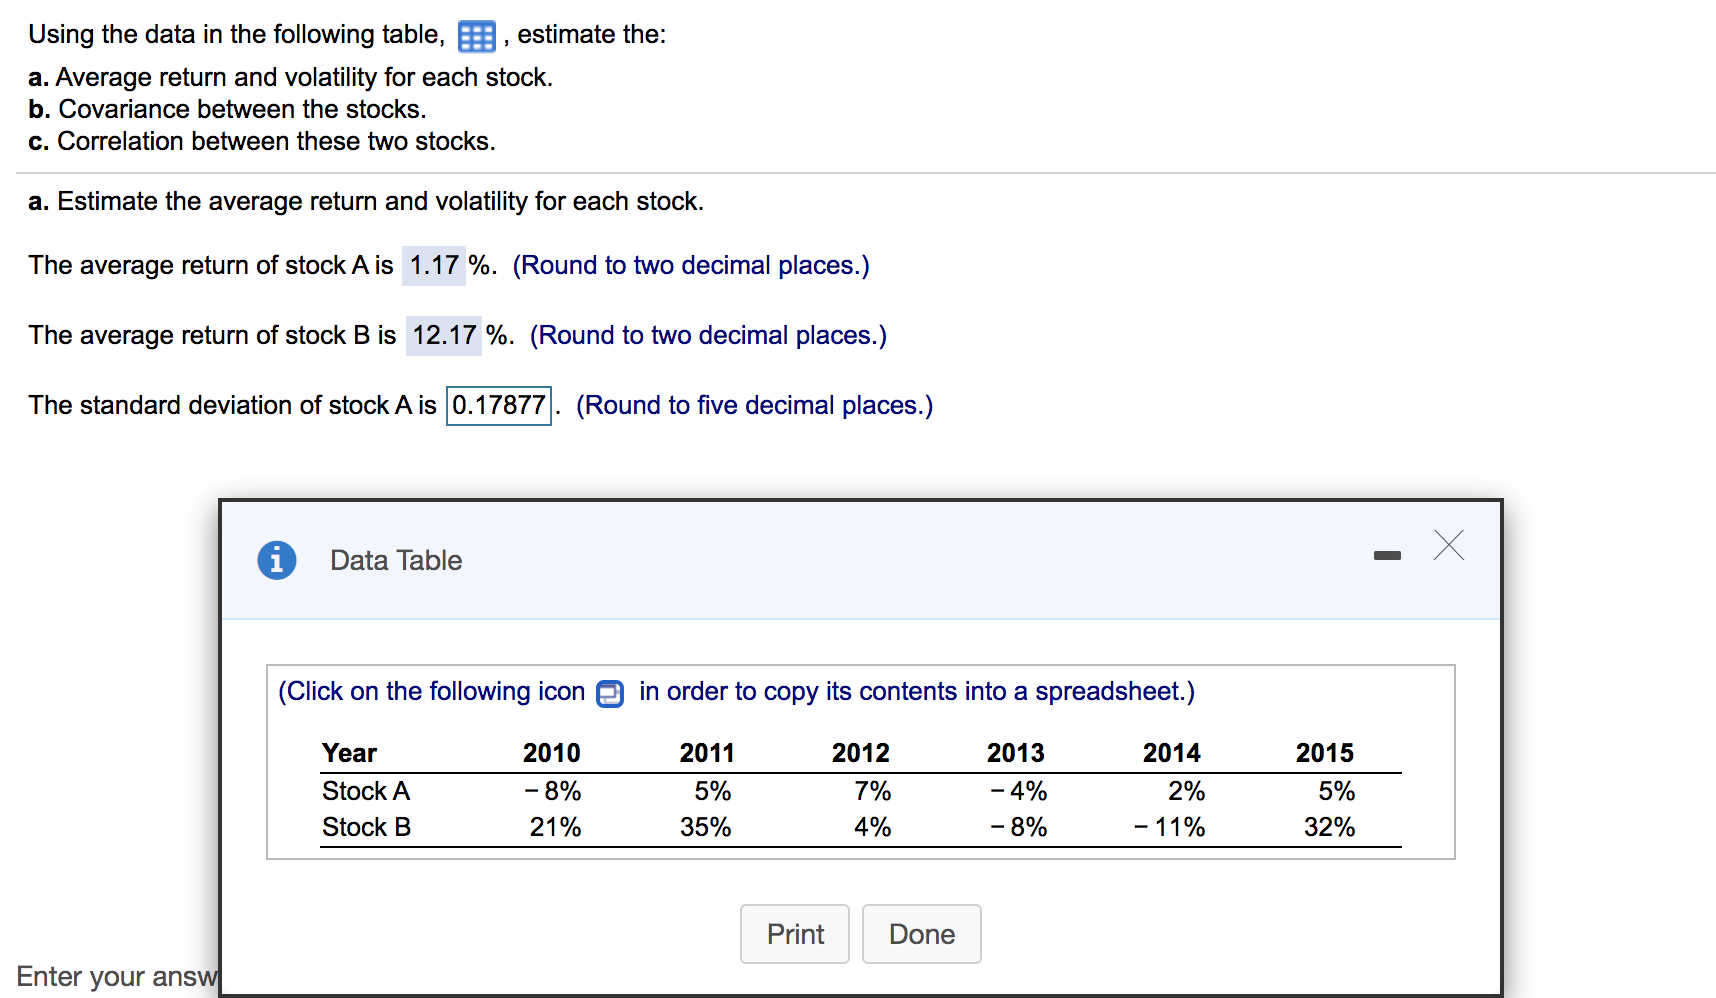
Using the data in the following table, a , estimate the: 3. Average return and volatility for each stock. b. Covariance between the stocks. c. Correlation between these two stocks. a. Estimate the average return and volatility for each stock. The average return of stockA is 1.17 %. (Round to two decimal places.) The average return of stock B is 12.17 %. (Round to two decimal places.) The standard deviation of stockA is 0.17877 . (Round to ve decimal places.) 0 Data Table (Click on the following icon 9 in order to copy its contents into a spreadsheet.) Year 2010 2011 2012 2013 2014 2015 Stock A - 8% 5% 7% - 4% 2% 5% Stock B 21% 35% 4% - 8% - 11% 32% Enter your ans
Step by Step Solution
There are 3 Steps involved in it

Get step-by-step solutions from verified subject matter experts