

Question: Using the data in the following table., estimate the a. Average return and volatility for each stock b. Covariance between the stocks c. Correlation between
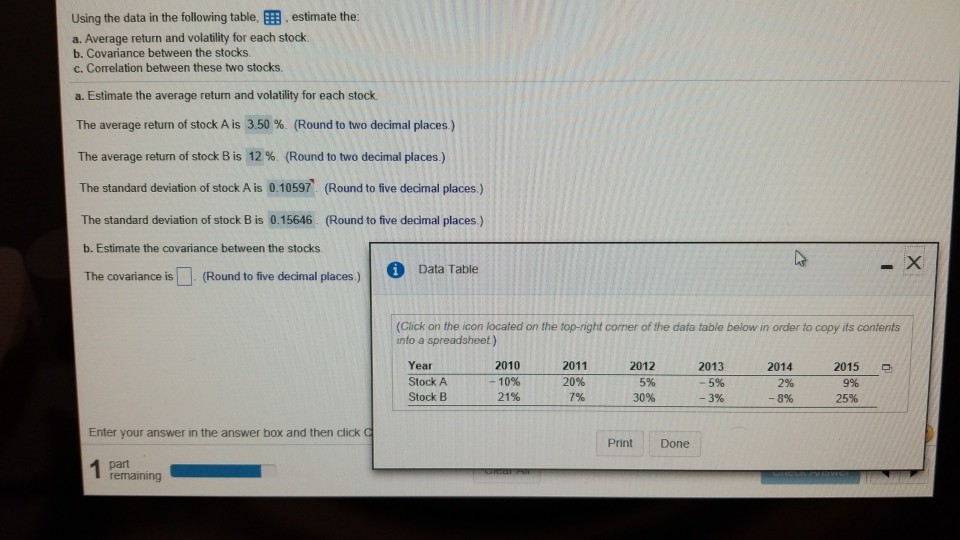
Using the data in the following table., estimate the a. Average return and volatility for each stock b. Covariance between the stocks c. Correlation between these two stocks a. Estimate the average return and volatility for each stock. The average return of stock A is 3.50 % (Round to two decimal places ) The average return of stock B is 12 % (Round to two decimal places) The standard deviation of stock A is 0.10597. (Round to five decimal places.) The standard deviation of stock B is 0.15646 (Round to five decimal places) b. Estimate the covariance between the stocks The covariance s Round o ive decinmal pacs)tasie (Click on the icon located on the top-right corner of the data table below in order to copy ifs contents into a spreadsheet) Year Stock A Stock B 2010 -10% 21% 2011 20% 7% 2012 5% 30% 2013 5% 3% 2014 2% -8% 2015 9% Enter your answer in the answer box and then click Print Done remaining
Step by Step Solution
There are 3 Steps involved in it

Get step-by-step solutions from verified subject matter experts