

Question: I was ask to resolve this given set of problem, using matlab the given equation, six equation with six unknown; ODE this are the value
I was ask to resolve this given set of problem, using matlab
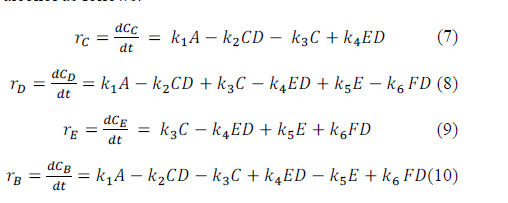
the given equation, six equation with six unknown; ODE
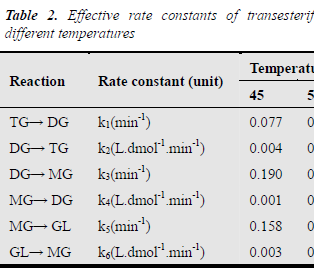
this are the value of k. at 45 celclius
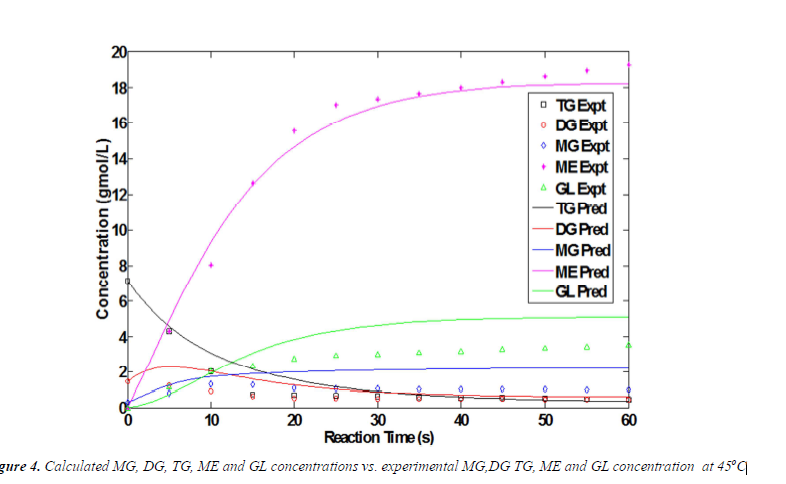
and the resulting answer in the form of a graph..,
you can assume, A=7.5 initially and B=1.
can you help me? how to find that graph?
the calculated Mg, Tg and others are the values of A,C,D etc,
the experimental value, is the linear plot of the calculated values. Thank you :)
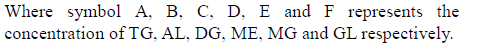
Where symbol A. B, C. D. E and F represents the concentration of TG, AL, DG, ME, MG and GL respectively. Where symbol A. B, C. D. E and F represents the concentration of TG, AL, DG, ME, MG and GL respectively
Step by Step Solution
There are 3 Steps involved in it

Get step-by-step solutions from verified subject matter experts