

Question: I was using Kay's Textbook to study MATLAB. There is one of the examples of drawing an estimated Gaussian graph. I use the same code
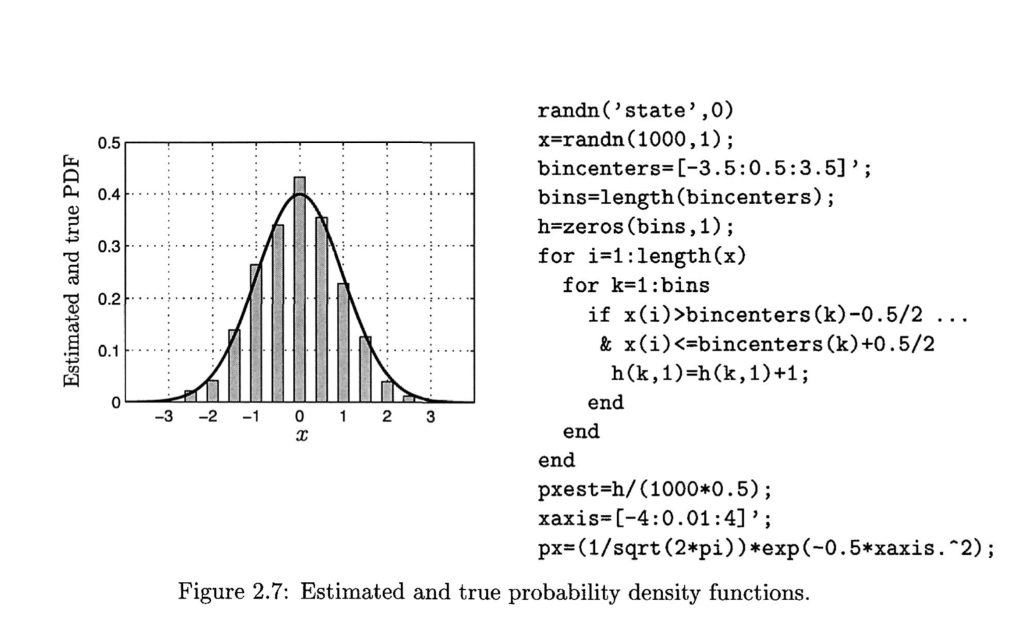 I was using Kay's Textbook to study MATLAB. There is one of the examples of drawing an estimated Gaussian graph. I use the same code but don't know how to represent the graph exactly like the one on the left. Please give me instructions on that! Thank you so much!
randn ( 'state' ,0) x-randn(1000,1); bincenters [-3.5:0.5:3.5]' bins-length(bincenters); h-zeros(bins,1); for i-1:length(x) 0.5 for k-1:bins 0.2 if x(i)>bincenters(k)-0.5/2 .. . & x(i)
Step by Step Solution
There are 3 Steps involved in it
1 Expert Approved Answer
Step: 1 Unlock

Question Has Been Solved by an Expert!
Get step-by-step solutions from verified subject matter experts
Step: 2 Unlock
Step: 3 Unlock