

Question: I will be using the date for college tuition for Public institutions. This includes 4- year universities from 2007-2018. It will exclude any 2 year
I will be using the date for college tuition for Public institutions. This includes 4- year universities from 2007-2018. It will exclude any 2 year programs or vocational programs. 10 years of data seemed like a good range.
Use the same data and forecast a trend line projection using the regression analysis techniques from Unit 8. Share the graph and next period prediction. Based on the graph, do you think this is a good model for this variable?
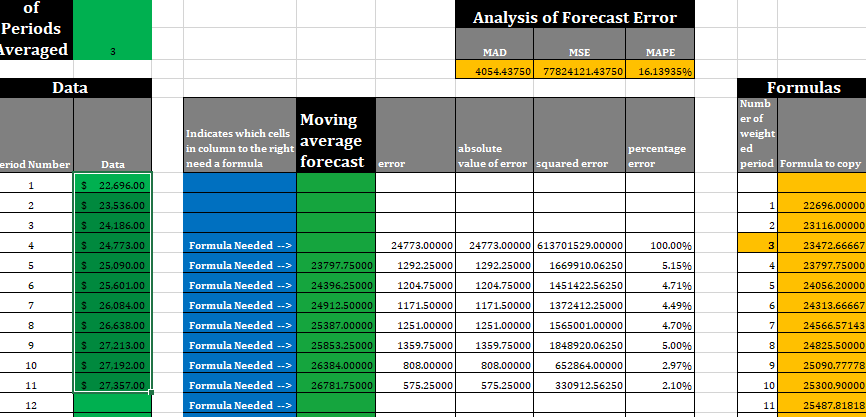
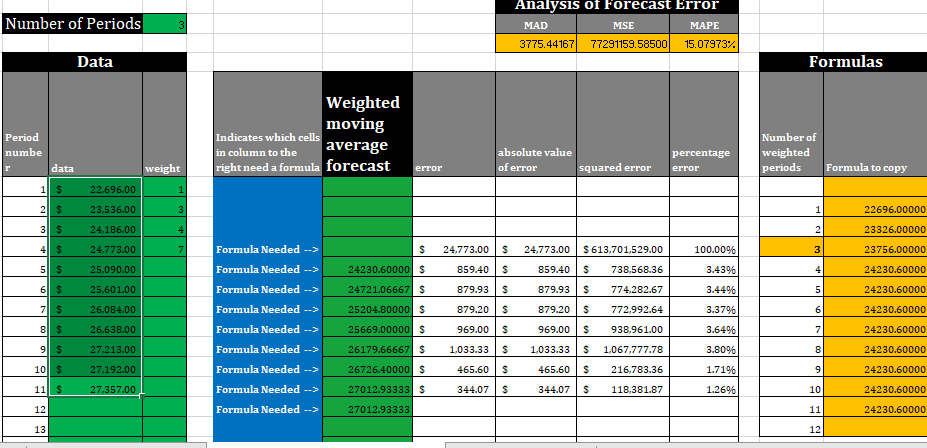
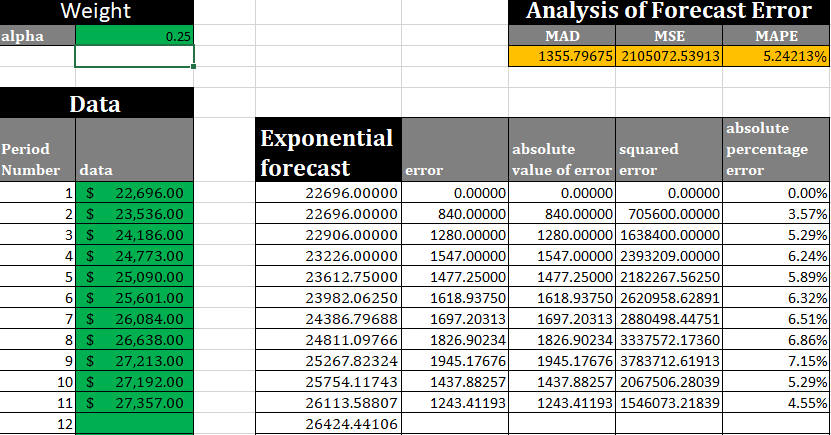
of Analysis of Forecast Error Periods Averaged 3 MAPE MAD MSE 4054.43750 77824121.43750 16.13935% Data Moving Indicates which cells in column to the right average need a formula forecast error Formulas Numb er of weight ed period Formula to copy absolute value of error squared error percentage error eriod Number Data 1 S 22,696.00 2 S 23,536.00 1 22696.00000 3 S 24,186.00 2 23116.00000 4 S 24,773.00 Formula Needed --> 24773.00000 100.00% 3 23472.66667 5 S 25,090.00 23797.75000 1292.25000 5.15% 4 23797.75000 6 S 25,601.00 24396.25000 1204.75000 24773.00000613701529.00000 1292.25000 1669910.06250 1204.75000 1451422.56250 1171.50000 1372412.25000 1251.00000 1565001.00000 4.719 5 24056.20000 7 S Formula Needed --> Formula Needed --> Formula Needed --> Formula Needed --> Formula Needed --> 26,084.00 24912.50000 1171.50000 4.49% 6 24313.66667 00 S 26,638.00 25387.00000 1251.00000 4.709 7 24566.57143 9 S 27,213.00 25853.25000 1359.75000 1359.75000 1848920.06250 8 24825.50000 5.00% 2.97% 10 S 27,192.00 Formula Needed --> 26384.00000 808.00000 808.00000 652864.00000 9 25090.77778 11 27,357.00 Formula Needed --> 26781.75000 575.25000 575.25000 330912.56250 2.10% 10 25300.90000 12 Formula Needed --> 11 25487.81818 Number of Periods 3 Analysis of orecast Error MAD MAPE 3775.4416777291159.58500 15.079737 MSE Data Formulas Period numbe r Weighted moving Indicates which cells in column to the average right need a formula forecast absolute value of error percentage error Number of weighted periods data weight error squared error Formula to copy 11 S 22,696.00 1 21 S 23,536.00 3 1 22696.00000 31 S 24,186.00 4 2 23326.00000 41 S 24,773.00 7 $ 24,773.00 $ 24,773.00 $ 613,701,529.00 100.00% 3 23756.00000 51 S 25.090.00 24230.60000 $ 859.40 $ 859.40 $ 738,568.36 3.43% 4 24230.60000 61 S 25,601.00 24721.06667 $ 879.93 $ 879.93 $ 774.282.67 3.44% 5 24230.60000 71 S 26,084.00 25204.80000 $ 879.20 $ 879.20 $ 772,992.64 3.37% 6 24230.60000 Formula Needed --> Formula Needed --> Formula Needed --> Formula Needed --> Formula Needed --> Formula Needed --> Formula Needed --> Formula Needed --> 81 S 26,638.00 25669.00000 $ 969.00 $ 969.00 $ 938,961.00 3.64% 7 24230.60000 91 S 27,213.00 26179.66667 $ 1,033.33 $ 1,033.33 S 1,067,777.78 3.80% 8 24230.60000 101 S 27,192.00 26726.40000 $ 465.60 $ 465.60 $ 216,783.36 1.71% 9 24230.60000 111 $ 27,357.00 27012.93333 $ 344.07 $ 344.07 $ 118,381.87 1.26% 10 24230.60000 12 Formula Needed --> 27012.93333 11 24230.60000 13 12 Weight alpha 0.25 Analysis of Forecast Error MAD MSE MAPE 1355.79675 2105072.53913 5.24213% Data Period Number data 1 $ 22,696.00 2 $ 23,536.00 3 $ 24,186.00 4 $ 24,773.00 5 $ 25,090.00 6 $ 25,601.00 7 $ 26,084.00 8 $ 26,638.00 9 $ 27,213.00 10 $ 27,192.00 11 $ 27,357.00 12 absolute Exponential absolute squared percentage forecast error value of error error error 22696.00000 0.000001 0.00000 0.000001 0.00% 22696.00000 840.000000 840.00000705600.00000 3.57% 22906.00000 1280.000000 1280.00000 1638400.00000 5.29% 23226.00000 1547.000000 1547.000002393209.00000 6.24% 23612.75000 1477.25000 1477.25000 2182267.56250 5.89% 23982.06250 1618.93750 1618.93750 2620958.62891 6.32% 24386.79688 1697.20313 1697.20313 2880498.44751 6.51% 24811.09766 1826.90234 1826.90234 3337572.17360 6.86% 25267.82324 1945.17676 1945.17676 3783712.61913 7.15% 25754.11743 1437.88257 1437.88257 2067506.28039 5.29% 26113.58807 1243.41193 1243.41193 1546073.21839 4.55% 26424.44106Step by Step Solution
There are 3 Steps involved in it
1 Expert Approved Answer
Step: 1 Unlock

Question Has Been Solved by an Expert!
Get step-by-step solutions from verified subject matter experts
Step: 2 Unlock
Step: 3 Unlock