

Question: i will upvote in Original Source 2, Development and initial validation of the Hanguver Symptoms Scale prevalence and correlates of hangover symptoms in college students,
i will upvote
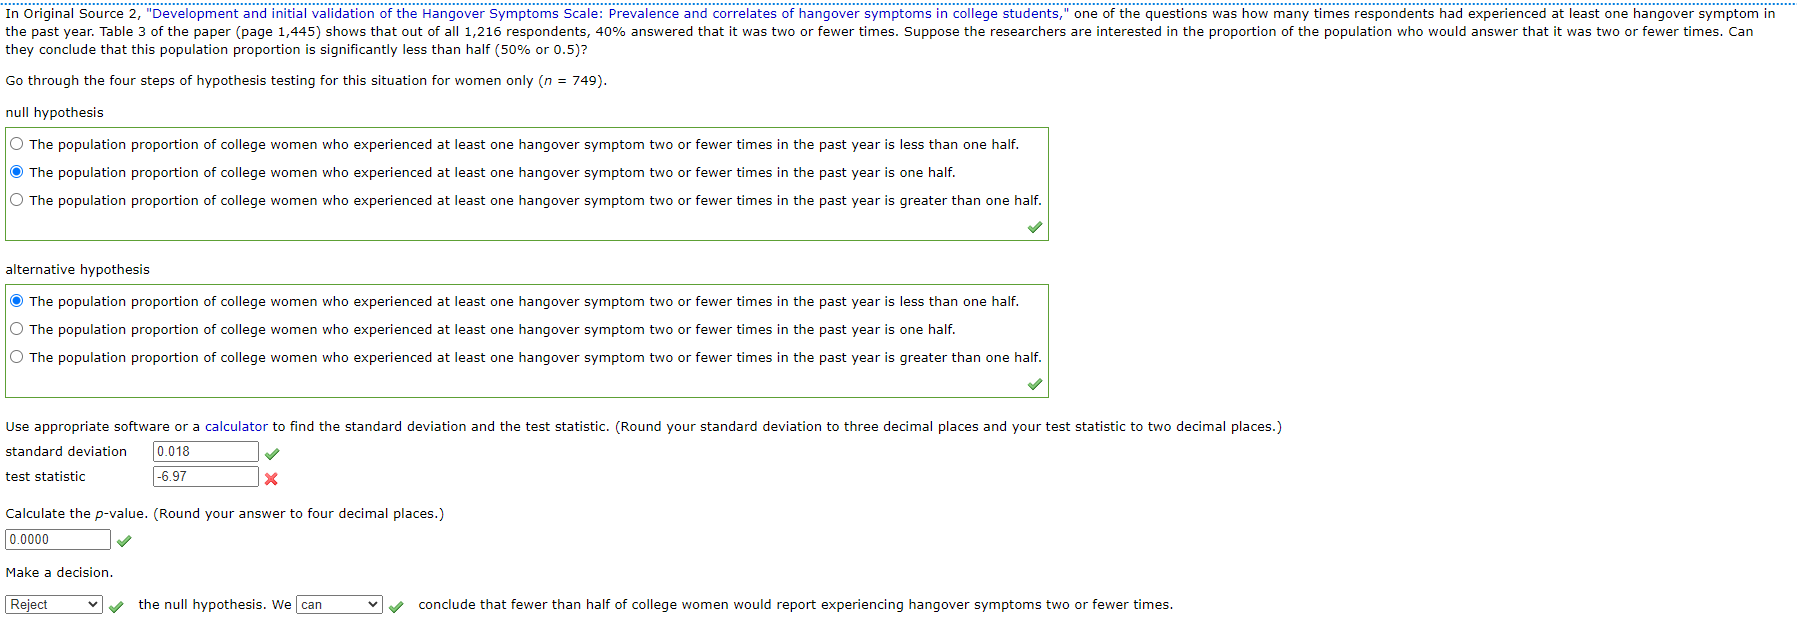
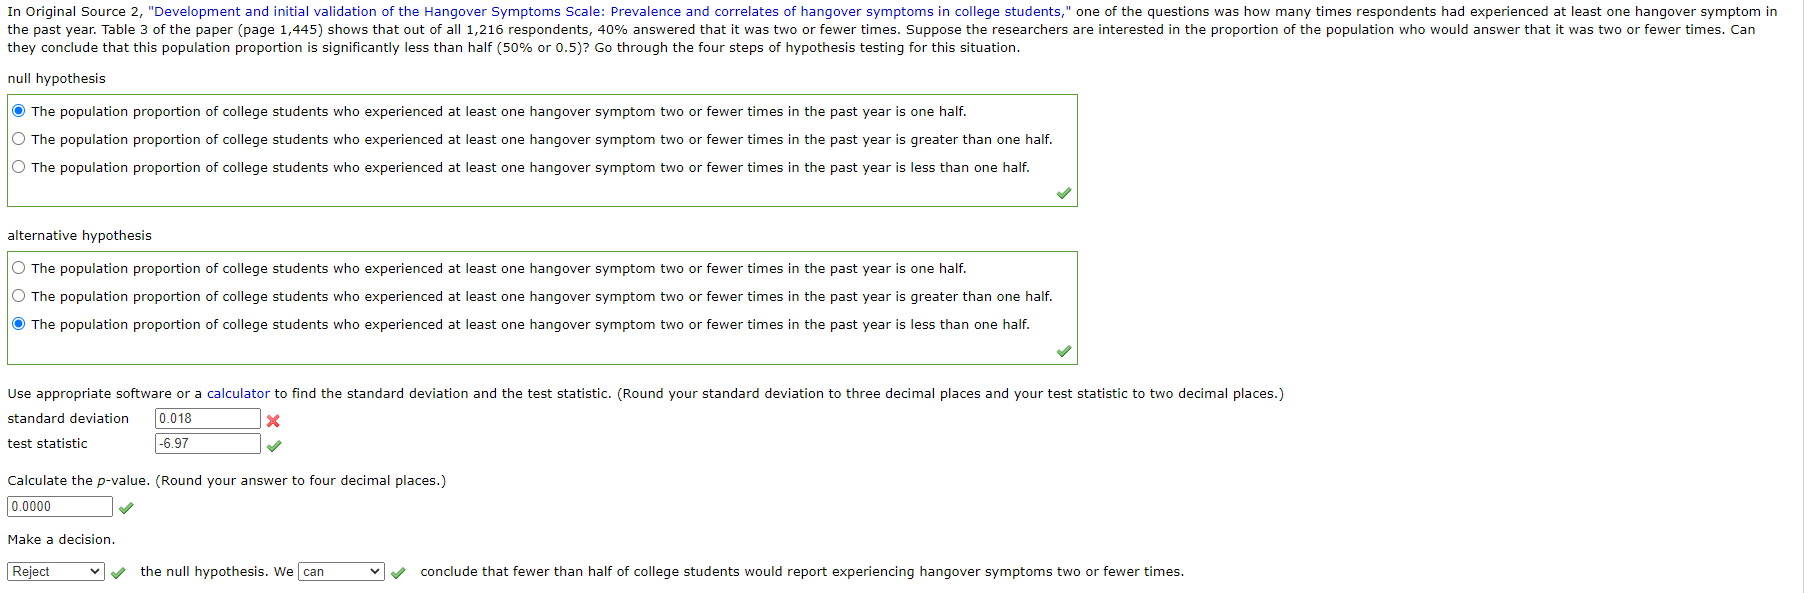
"in Original Source 2, Development and initial validation of the Hanguver Symptoms Scale prevalence and correlates of hangover symptoms in college students, one or the questions was how many times respondents had experienced at least one hangover symptom in the past year. Table 3 ofthe paper (page 1.445) shows that out of all 1,215 respondents, 40% answered that it was two orfewer times. Suppose the researchers are interested in the proportion of the population who would answer that it was two or fewer times can they conclude that this population proportion is significantly less than half (50% or 0.5) Go through the four steps of hypothesis testing tor this situation for women only (n = 749; null hypothesis C- The population proportion of college women who experienced at least one hangover symptom two or fewer times in the past year is less than one half. The population proportion of college women who experienced at least one hangover symptom two or fewer times in the past year is one half. The population proportion of college women who experienced at least one hangover symptom two or fewer times in the past year is greater than one half. of alternatiye hypothesis The population proportion of college women who experienced at least one hangover symptom two or fewer times in the past year is less than one half. The population proportion of college women who experienced at least one hangover symptom two or fewer times in the past year is one half. The population proportion of college women who experienced at least one hangover symptom two or fewer times in the past year is greater than one half. J Use appropriate software or a calculator to find the standard deviation and the test statistic. (Round your standard deviation to three decimal places and your test statistic to two decimal places.) standard deviation 0 018 \\y test statistic x Calculate the pcvalue (Round your answerto four decimal places.) uuoou y Make a decision J the null hypothesis. We J conclude that fewer than half of college women would report experiencing hangover symptoms two or fewer times In original Source 2, \"Development and initial validation of the Hanguver Symptoms Stale: prevalence and correlates of hangoyer symptoms in college students,\" one or the questions was how many times respondents had experienced at least one hangover symptom in the past year. Table 3 orthe paper (page 1,445) shows that out of all 1,215 respondents, 40% answered that it was two or fewer times. Suppose the researchers are interested in the proportion of the population who would answer that it was two or fewer times can they conclude that this population proportion is significantly less than half (son/a or 0.5)) Go through the four steps of hypothesis testing for this situation null hypothesis The population proportion of college students who experienced at least one hangover symptom two or fewer times in the past year is one hair. -:.i The population proportion of college students who experienced at least one hangover symptom two or fewer times in the past year is greater than one hair. -:'i The population proportion of college students who experienced at least one hangover symptom two or fewer times in the past year is less than one half. J alternative hypothesis Q The population proportion or college students who experienced at least one hangover symptom two or rewer times in the past year is one hair. Q The population proportion or college students who experienced at least one hangover symptom two or rewer times in the past year is greater than one hair. 6) The population proportion of college students who experienced at least one hangover symptom two or fewer times in the past year is less than one half. J Use appropriate sohware or a calculator to find the standard deviation and the test statistic. (Round your standard deviation to three decimal places and your test statistic to two decimal places.) standard deviation 0.018 x test statistic y Caltulate the pcvaiue (Round your answerto rour decimal places.) a neon Make a decl J the null hypothesis. We 4 conclude that fewerthan half or college students would report experiencing hangover symptoms two or fewer times. uni
Step by Step Solution
There are 3 Steps involved in it

Get step-by-step solutions from verified subject matter experts