

Question: I worked out the data on the SPSS program but I have see two p test, one sided and two sided. I am not sure
I worked out the data on the SPSS program but I have see two p test, one sided and two sided. I am not sure how to answer this question. I according to the question they are looking for a percentage but I am not sure which number to use. Below is the chart that I created from the data in SPSS. In bold is the question my homework is asking.
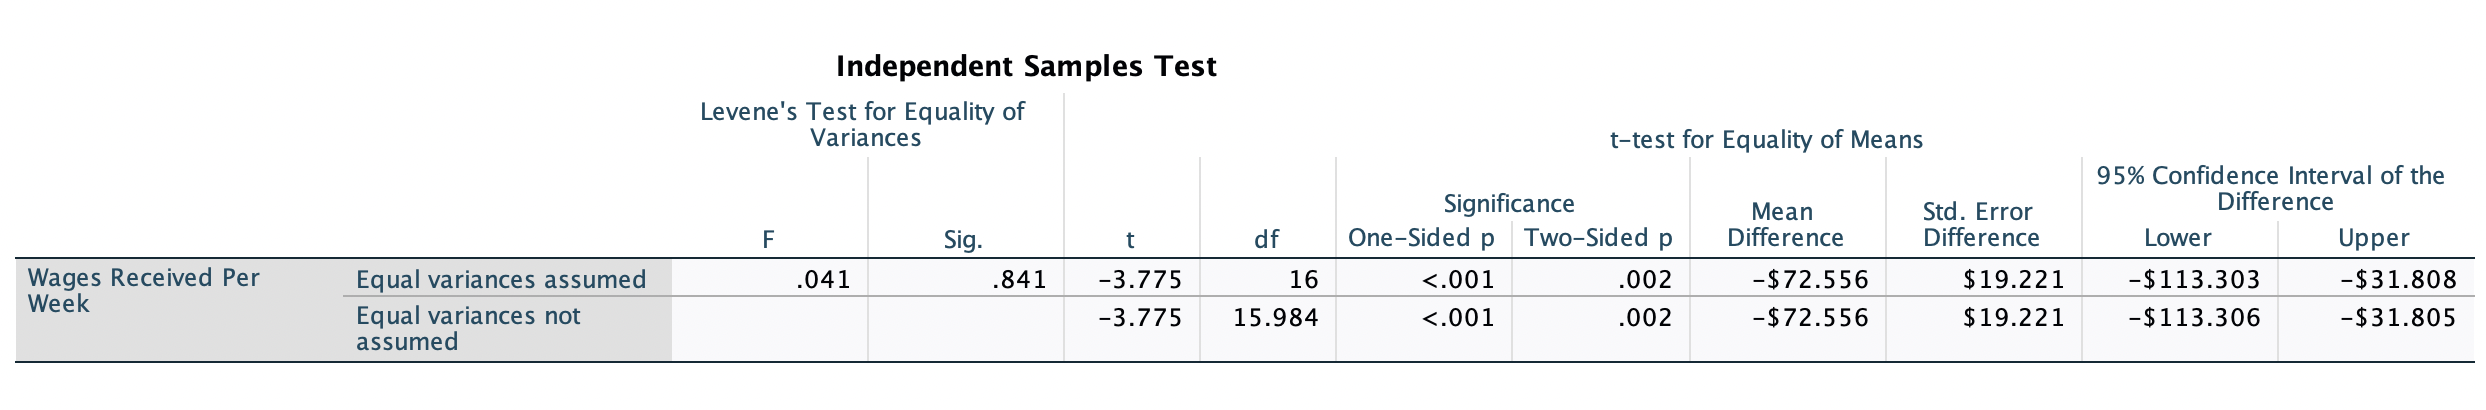
Independent Samples Test Levene's Test for Equality of Variances t-test for Equality of Means 95% Confidence Interval of the Significance Mean Std. Error Difference F Sig. df One-Sided p Two-Sided p Difference Difference Lower Upper Wages Received Per Equal variances assumed 041 .841 -3.775 16 <.001 .002 week equal variances not assumed>
Step by Step Solution
There are 3 Steps involved in it

Get step-by-step solutions from verified subject matter experts