Question: I worked this problem out but need to know if I did it correctly. I have submitted an image for your review. Thank you! X-bar
I worked this problem out but need to know if I did it correctly. I have submitted an image for your review. Thank you!
X-bar (mean chart) using Z-score
A beverage company would like to use a mean chart (x-bar chart) to monitor how much liquid beverage it puts into each 800 ml bottle. They know from past experience that whenever this process is under control, bottle weight is normally distributed with a mean of 800 and a standard deviation of 6.5 ml. The company plans to measure samples of 49 bottles from the production line every hour, and record the mean weight of liquid beverage in the bottles.
a. If the company uses z=3.0 as its standard for establishing the mean chart, where will the upper and lower control limits be on that chart?
b) For legal reasons, the company cannot tolerate more than 905 or less than 895 ml in each bottle. What is the process capability index value for this bottling process? What does it indicate about the process?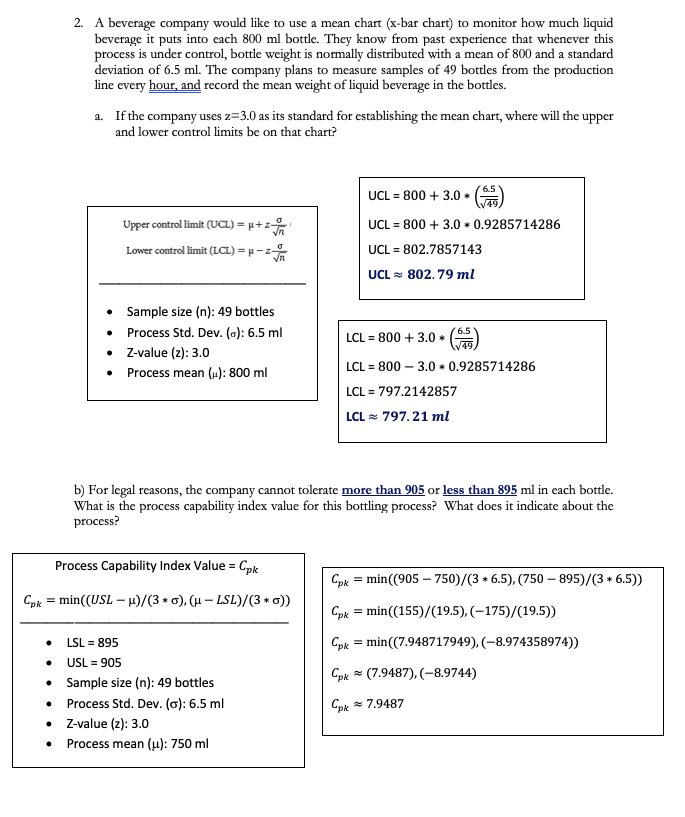
2. A beverage company would like to use a mean chart (x-bar chart) to monitor how much liquid beverage it puts into each 800 ml bottle. They know from past experience that whenever this process is under control, bottle weight is normally distributed with a mean of 800 and a standard deviation of 6.5 ml. The company plans to measure samples of 49 bottles from the production line every hour, and record the mean weight of liquid beverage in the bottles. 2. If the company uses z=3.0 as its standard for establishing the mean chart, where will the upper and lower control limits be on that chart? Upper control limit (UCL)=u+zin Lower control limit (LCL) = -2 UCL = 800 + 3.0 (3) UCL = 800 + 3.0 - 0.9285714286 UCL = 802.7857143 UCL 802.79 ml 6.5 Sample size (n): 49 bottles Process Std. Dev. (c): 6.5 ml Z-value (z): 3.0 Process mean (H): 800 ml LCL = 800 + 3.0 LCL = 800 3.0 + 0.9285714286 LCL = 797.2142857 LCL = 797.21 ml b) For legal reasons, the company cannot tolerate more than 905 or less than 895 ml in each bottle. What is the process capability index value for this bottling process? What does it indicate about the process? Process Capability Index Value = pk Cpk = min((USL - )/(36), (u - LSL)/(3 + o)) Cpx = min((905 750)/(3 * 6.5), (750 - 895)/(3 * 6.5)) Cpx = min((155)/(19.5),(-175)/(19.5)) LSL = 895 pk = min((7.948717949),(-8.974358974)) . Cpx (7.9487),(-8.9744) USL - 905 Sample size (n): 49 bottles Process Std. Dev. (6): 6.5 ml Z-value (z): 3.0 Process mean (u): 750 ml Cpx 7.9487


