

Question: I would like an excel doc with columns and rows showing. One doc with just answers , one doc with the formulas expande d. This
- I would like an excel doc with columns and rows showing. One doc with just answers, one doc with the formulas expanded. This is the only way I can understand the answers and how to do the problem. Word answer to the second question at the end of this doc can be part of the excel doc, just put it below the tables.
- I have attached an "Example Case Study" to show an example of how my question should be solved. The example is just for reference to understand what I need help with and it is a similar case study to the question I am asking.
- I tried to get help with Course Hero and they could now answer this case study.
HOMEWORK CASE STUDY/QUESTION
"Case Study Northeastern Airlines
Northeastern Airlines is a regional airline serving nine cities in the New England states, as well as cities in New York, New Jersey, and Pennsylvania. While nonstop flights are available for some of the routes, connecting flights are often necessary. The network shows the cities served and profit in U.S. dollars per passenger along each of these routes. To service these cities, Northeastern operates a fleet of eighteen 122-passenger Embraer E-195 jets. These jets, which were first introduced by Embraer in late 2004, have helped Northeastern Airlines remain profitable for a number of years. However, in recent years, the profit margins have been falling, and Northeastern is facing the prospect of downsizing its operations.
Management at Northeastern Airlines has considered several options to reduce cost and increase profitability. Due to Federal Aviation Administration regulations, the company must continue to serve each of the nine cities. How it serves these cities, however, is up to the management at Northeastern. One suggestion has been made to provide fewer direct flights, which would mean that a city served by Northeastern might have direct flights to only one other city. The company plans to hire a marketing analytics consultant to determine how demand would be impacted by longer flights with more connections and to forecast the demand along each of the routes based on a modified flight operations map. Before hiring the consultant, the company would like to determine the most profitable (on a profit-per-passenger basis) way to continue serving all of the cities."
MAP FOR CASE STUDY
QUESTIONS FOR THIS CASE STUDY/HOMEWORK TO BE ANSWERED
- Develop a flight map that still serves each of the nine cities (see attached "homework map") but, also maximizes the company's profit per passenger. The book HINT is" Find the maximal-spanning tree. Please answer (in detail) showing both the answers but also the formulas. Row and columns should be shown.
- Comment on how the 18 jets should be assigned.
HERE IS A SAMPLE STUDY THAT WAS ALREADY COMPLETED BY THE BOOK. I thought this may be helpful
EXAMPLE for the above question
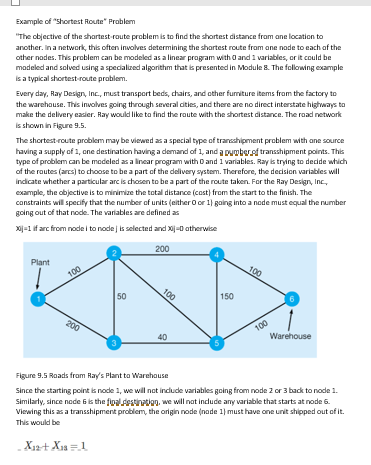
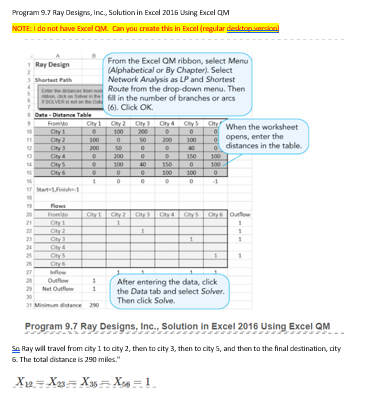
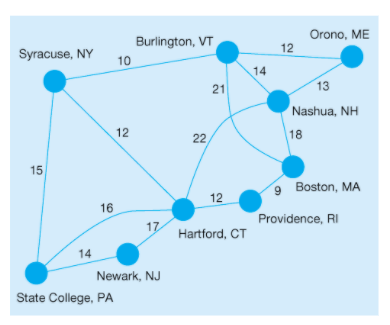
Orono, ME Syracuse, NY Burlington, VT 10 12 14 21 13 Nashua, NH 18 12 22 15 16 9 Boston, MA 12 Providence, RI Hartford, CT 17 14 Newark, NJ State College, PA Example of "Shortest Route" Problem "The objective of the shortest route problem is to find the shortest distance from one location to another. In a network, this often involves determining the shortest route from one node to each of the other nodes. This problem can be modeled as a linear program with O and 1 variables, or it could be modeled and solved using a specialized algorithm that is presented in Module 8. The following example is a typical shortest route problem. Every day, Ray Design, Inc., must transport beds, chairs, and other furniture items from the factory to the warehouse. This involves going through several cities, and there are no direct Interstate highways to make the delivery easier. Ray would like to find the route with the shortest distance. The road network is shown in Figure 9.5. The shortest route problem may be viewed as a special type of transhipment problem with one source having a supply of 1, one destination having a demand of 1, and a pobref transshipment points. This type of problem can be modeled as a linear program with O and I variables. Ray is trying to decide which of the routes (ancs) to choose to be a part of the delivery system. Therefore, the decision variables will indicate whether a particular arc is chosen to be a part of the route taken. For the Ray Design, Inc. example, the objective is to minimize the total distance (cast from the start to the finish. The constraints will specify that the number of units (either Oor 1going into a node must equal the number going out of that node. The variables are defined X-1 if arc from node to node is selected and X2]=otherwise 200 Plant 100 100 50 100 150 6 200 100 40 Warehouse 3 Figure 9.5 Roads from Ray's Plantta Warehouse Since the starting point is node 1, we will natindude variables going from node 2 or 3 back to node 1. Similarly, since node 6 is the foldestination, we will not include any variable that starts at node 6. Viewing this as a transshipment problem, the origin node (node 1) must have one unit shipped out of it. This would be X12+ X1s=1 The fou desirati node (node 6) must have che unit shipped to it, and this is written as X+Xe =1.. Each intermediate rode will have a constraint requiring the amount coming into the node to equal the amount going out of that node fi.c., the flow into a node minus the flow out of a node must equal zero). For node this would be X12+ Xx XX+X36 This simplifies to X19.+ X12 - Xxx - XXx0 The other constraints would be constructed in a similar manner. The linear program is Minimize distance 100X2 + 200X18+50Xs +50Xx3 + 200Xs: +200 Xe + 100% .+ 100X0 + 40X34 + 40X3s + 150X. + 150X+ 100.X + 100X subject to Xos X12 + X13 =-1- - 1 - - Node 1 X12 + Xxx - X - X - X3 = 0 Node 2 X1 + Xg X2 X3 = 0 Node 3 X24 + X4 X:46 = 0 Node 4 Xys + Xss + X. - X. XS - X - XS6 - X = 0 Node 5 X6 + Xs6 = 1 Node 6 All variables = Oor 1 While this problem could be solved a linear program, using Excel M is the easiest way to obtain the solutions. To solve a shortest route problem, from the Excel OM ribbon, select Network Analysis as LP and then choose Shortest Path. In the initialization window that opens, you enter the number of nodes (6) and click OK. A worksheet is developed, as seen in Program 9.7. Enter the data for the distances, and then dick Solver from the Data ribbon. Click Solve from the Solver input window, and the results (flows) are put into the worksheet. From Program 9.7, we see that Program 9.7 Ray Design, Inc., Solution in Excel 2016 Using Excel OM NOTE: I do not have Excel OM. Can you create this in Excel (regular desktop version 2 Ray Design Shortest Path 6 7 SOLVER From the Excel OM ribbon, select Menu (Alphabetical or By Chapter). Select Network Analysis as LP and Shortest Route from the drop-down menu. Then fill in the number of branches or arcs (6). Click OK When the worksheet opens, enter the distances in the table. Date Distance Table Chyt Chy2 0 300 200 200 BISBE 50 0 0 40 O 0 0 100 100 0 100 40 190 0 100 0 100 150 100 Gly 0 0 o Gytyydyshy Outlow 20 1 Ghy --- 23 24 CES 27 Outlow 23 Nut Outflow 30 1 Minimum distance 750 Alter entering the data, click the Data tab and select Solver Then click Solve Program 9.7 Ray Designs, Inc., Solution in Excel 2016 Using Excel QM So Ray will travel from city I to dty 2. then to city 3, then to city 5, and then to the final destination.city 6. The total distance is 290 miles." X12. = X2=X35X=1 Orono, ME Syracuse, NY Burlington, VT 10 12 14 21 13 Nashua, NH 18 12 22 15 16 9 Boston, MA 12 Providence, RI Hartford, CT 17 14 Newark, NJ State College, PA Example of "Shortest Route" Problem "The objective of the shortest route problem is to find the shortest distance from one location to another. In a network, this often involves determining the shortest route from one node to each of the other nodes. This problem can be modeled as a linear program with O and 1 variables, or it could be modeled and solved using a specialized algorithm that is presented in Module 8. The following example is a typical shortest route problem. Every day, Ray Design, Inc., must transport beds, chairs, and other furniture items from the factory to the warehouse. This involves going through several cities, and there are no direct Interstate highways to make the delivery easier. Ray would like to find the route with the shortest distance. The road network is shown in Figure 9.5. The shortest route problem may be viewed as a special type of transhipment problem with one source having a supply of 1, one destination having a demand of 1, and a pobref transshipment points. This type of problem can be modeled as a linear program with O and I variables. Ray is trying to decide which of the routes (ancs) to choose to be a part of the delivery system. Therefore, the decision variables will indicate whether a particular arc is chosen to be a part of the route taken. For the Ray Design, Inc. example, the objective is to minimize the total distance (cast from the start to the finish. The constraints will specify that the number of units (either Oor 1going into a node must equal the number going out of that node. The variables are defined X-1 if arc from node to node is selected and X2]=otherwise 200 Plant 100 100 50 100 150 6 200 100 40 Warehouse 3 Figure 9.5 Roads from Ray's Plantta Warehouse Since the starting point is node 1, we will natindude variables going from node 2 or 3 back to node 1. Similarly, since node 6 is the foldestination, we will not include any variable that starts at node 6. Viewing this as a transshipment problem, the origin node (node 1) must have one unit shipped out of it. This would be X12+ X1s=1 The fou desirati node (node 6) must have che unit shipped to it, and this is written as X+Xe =1.. Each intermediate rode will have a constraint requiring the amount coming into the node to equal the amount going out of that node fi.c., the flow into a node minus the flow out of a node must equal zero). For node this would be X12+ Xx XX+X36 This simplifies to X19.+ X12 - Xxx - XXx0 The other constraints would be constructed in a similar manner. The linear program is Minimize distance 100X2 + 200X18+50Xs +50Xx3 + 200Xs: +200 Xe + 100% .+ 100X0 + 40X34 + 40X3s + 150X. + 150X+ 100.X + 100X subject to Xos X12 + X13 =-1- - 1 - - Node 1 X12 + Xxx - X - X - X3 = 0 Node 2 X1 + Xg X2 X3 = 0 Node 3 X24 + X4 X:46 = 0 Node 4 Xys + Xss + X. - X. XS - X - XS6 - X = 0 Node 5 X6 + Xs6 = 1 Node 6 All variables = Oor 1 While this problem could be solved a linear program, using Excel M is the easiest way to obtain the solutions. To solve a shortest route problem, from the Excel OM ribbon, select Network Analysis as LP and then choose Shortest Path. In the initialization window that opens, you enter the number of nodes (6) and click OK. A worksheet is developed, as seen in Program 9.7. Enter the data for the distances, and then dick Solver from the Data ribbon. Click Solve from the Solver input window, and the results (flows) are put into the worksheet. From Program 9.7, we see that Program 9.7 Ray Design, Inc., Solution in Excel 2016 Using Excel OM NOTE: I do not have Excel OM. Can you create this in Excel (regular desktop version 2 Ray Design Shortest Path 6 7 SOLVER From the Excel OM ribbon, select Menu (Alphabetical or By Chapter). Select Network Analysis as LP and Shortest Route from the drop-down menu. Then fill in the number of branches or arcs (6). Click OK When the worksheet opens, enter the distances in the table. Date Distance Table Chyt Chy2 0 300 200 200 BISBE 50 0 0 40 O 0 0 100 100 0 100 40 190 0 100 0 100 150 100 Gly 0 0 o Gytyydyshy Outlow 20 1 Ghy --- 23 24 CES 27 Outlow 23 Nut Outflow 30 1 Minimum distance 750 Alter entering the data, click the Data tab and select Solver Then click Solve Program 9.7 Ray Designs, Inc., Solution in Excel 2016 Using Excel QM So Ray will travel from city I to dty 2. then to city 3, then to city 5, and then to the final destination.city 6. The total distance is 290 miles." X12. = X2=X35X=1
Step by Step Solution
There are 3 Steps involved in it

Get step-by-step solutions from verified subject matter experts