Question: I would like question 3 (a, b c d answered) with an explanation for answer as well as formulas for calculations Q: J The table
I would like question 3 (a, b c d answered) with an explanation for answer as well as formulas for calculations
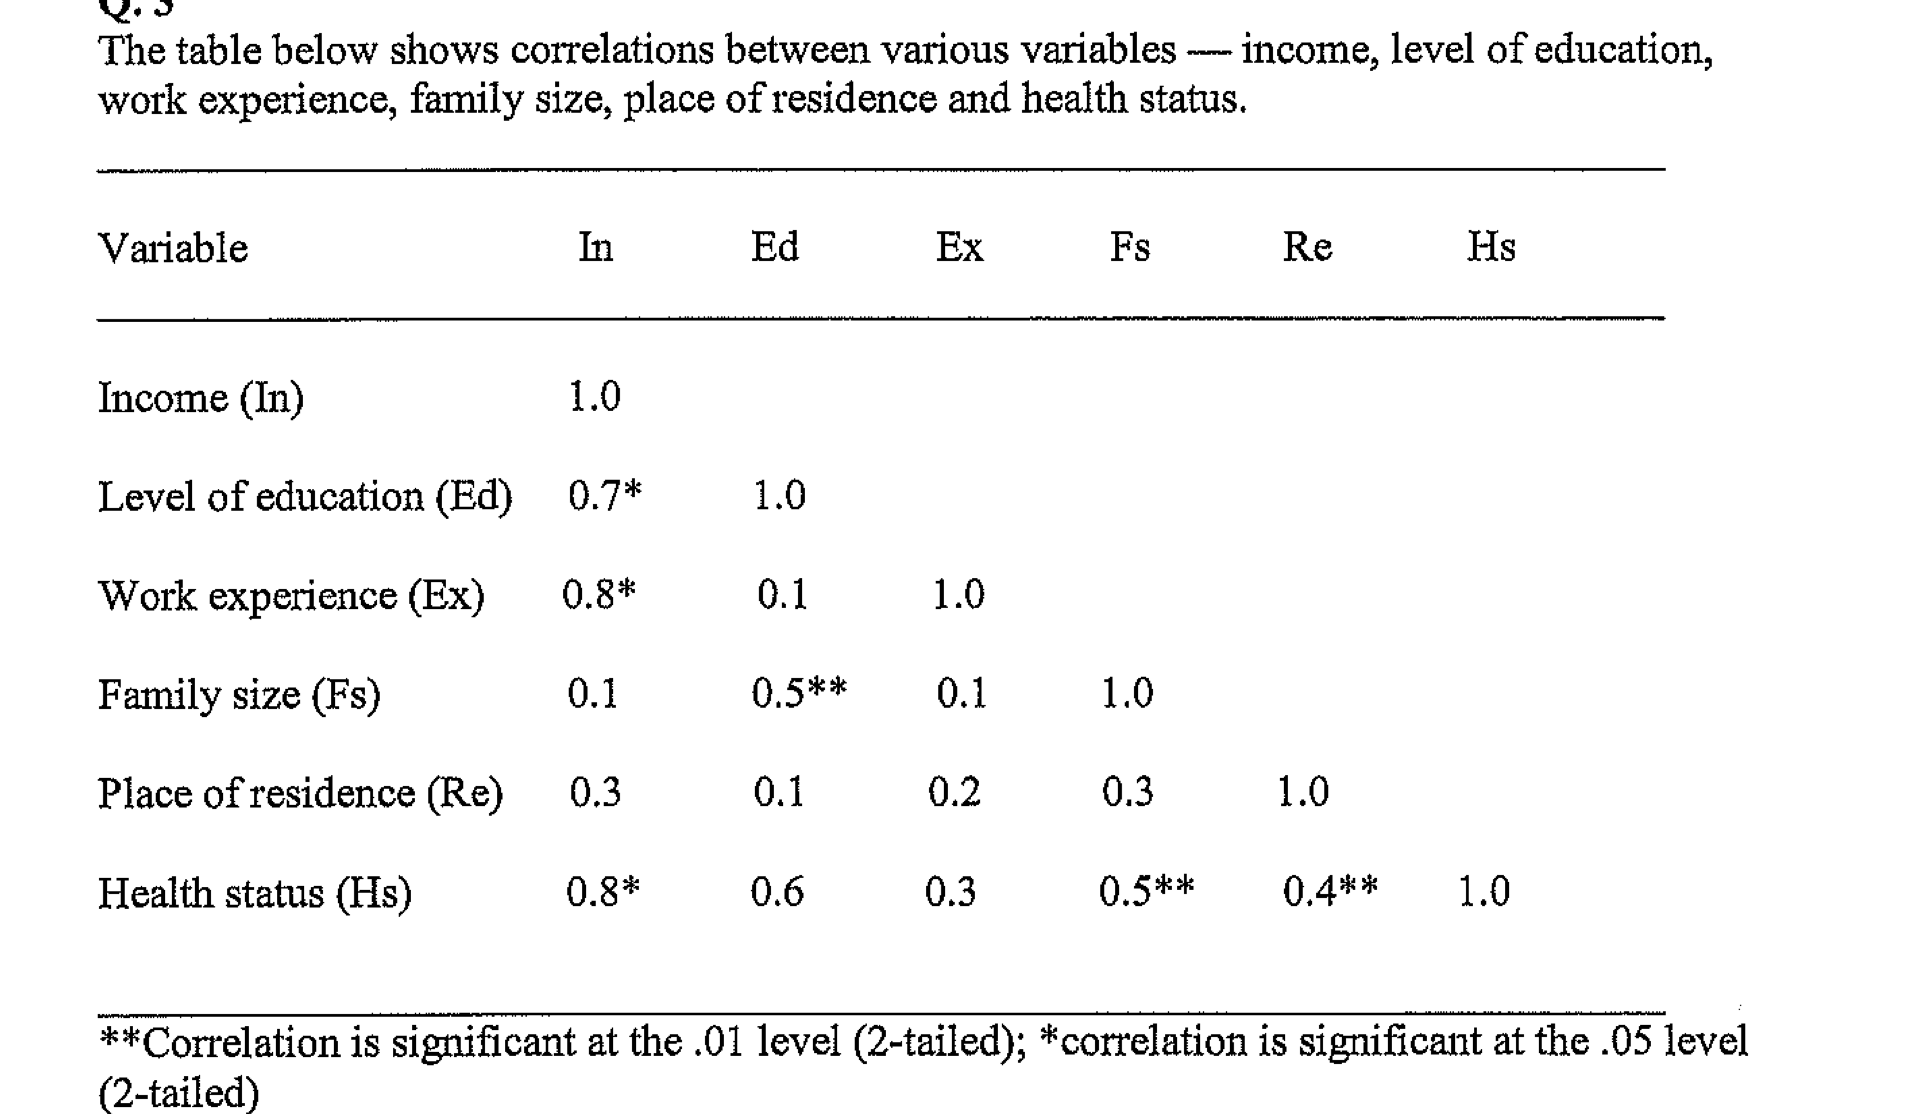
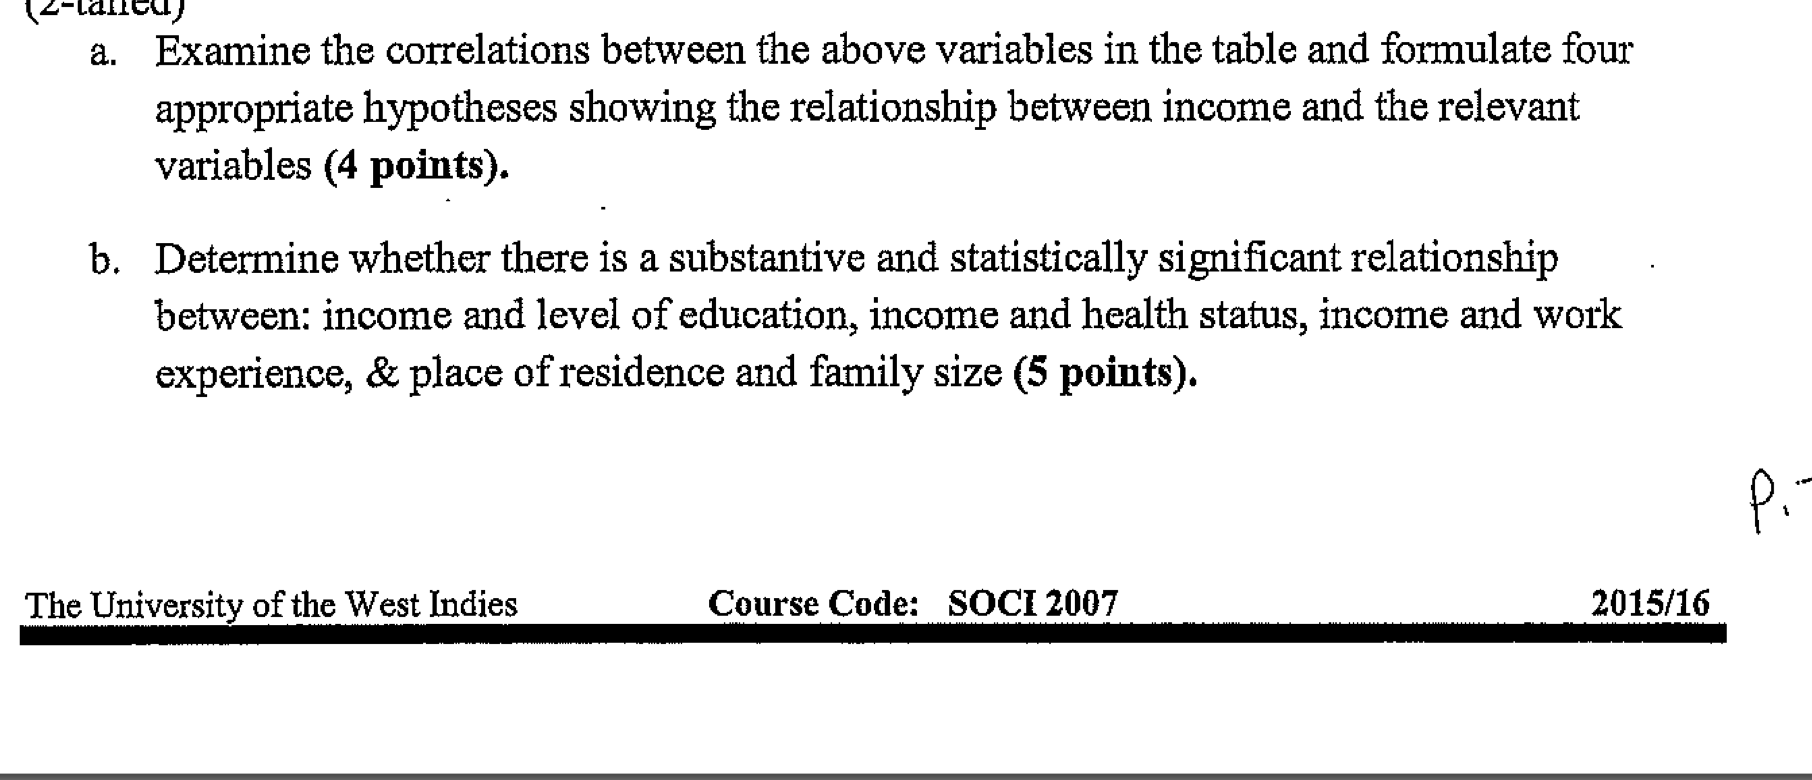
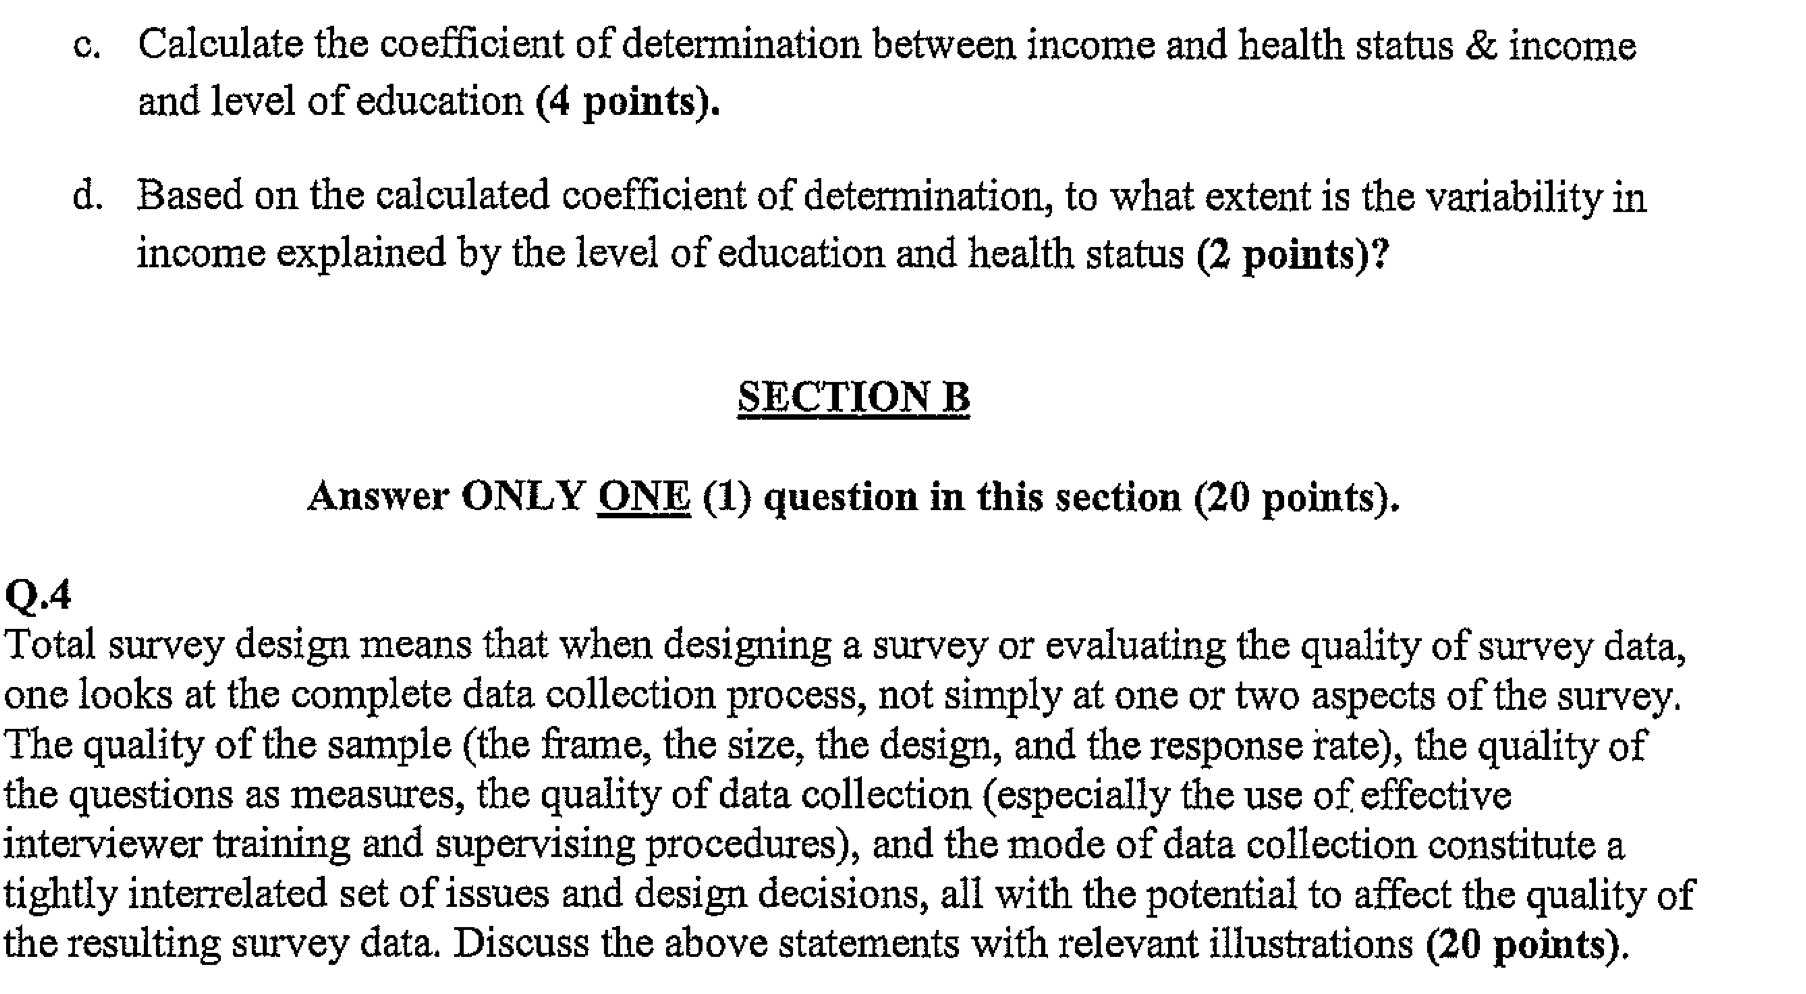
Q: J The table below shows correlations between various variables -- income, level of education, work experience, family size, place of residence and health status. Variable In Ed Ex Fs Re Hs Income (In) 1.0 Level of education (Ed) (17* 1.0 Work experience (Ex) 0.8* 0.1 1.0 Family size (Fs) 0.1 0.5\"\" 0.1 1.0 Place of residence (Re) 0.3 0.1 0.2 0.3 1.0 Health status (H5) 0.8"\" 0.6 0.3 0.5** 0.4\" 1.0 **Correlation is signicant at the .01 level (Z-tailed); *correlation is signicant at the .05 level (2-tailed) k- LulLGUJ a. Examine the correlations between the above variables in the table and formulate four appropriate hypotheses showing the relationship between income and the relevant variables (4 points). b. Determine whether there is a substantive and statistically signicant relationship between: income anti level of education, income and health status, income and work experience, & place of residence and family size (5 points). 9., The University of the West Indies Course Code: SOCI 2067 2015/16 w 0. Calculate the coefcient of detennination between income and health status & income and level of education (4 points). (1. Based on the calculated coefcient of determination, to what extent is the variability in income explained by the level of education and health status (2 points)? SECTION B Answer ONLY ONE (1) question in this section (20 points). Q.4 Total survey design means that when designing a survey or evaluating the quality of survey data, one looks at the complete data collection process, not simply at one or two aspects of the survey. The quality of the sample (the frame, the size, the design, and the response rate), the quality of the questions as measures, the quality of data collection (especially the use of. effective interviewer training and supervising procedures), and the mode of data collection constitute a tightly interrelated set of issues and design decisions, all with the potential to affect the quality of the resulting survey data. Discuss the above statements with relevant illustrations (20 points)