

Question: I would like some detailed step by step solution for the following Inference for One-Sample Population Means - Part 2 Exercise 1. The Group of


I would like some detailed step by step solution for the following Inference for One-Sample Population Means - Part 2 Exercise

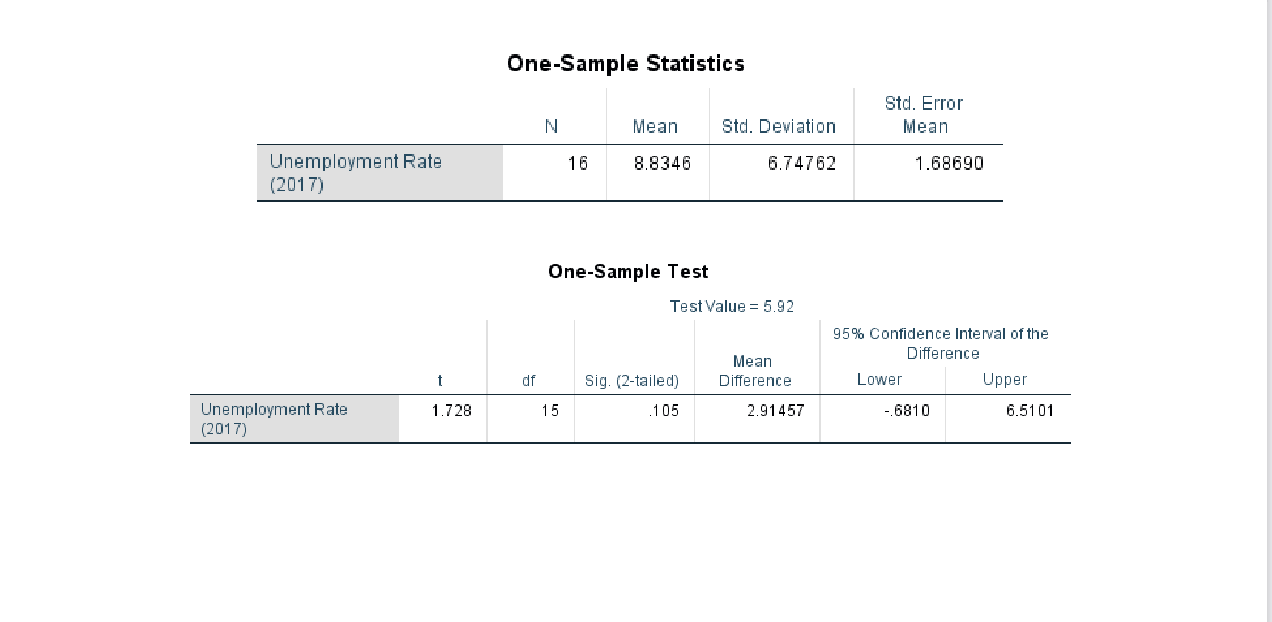
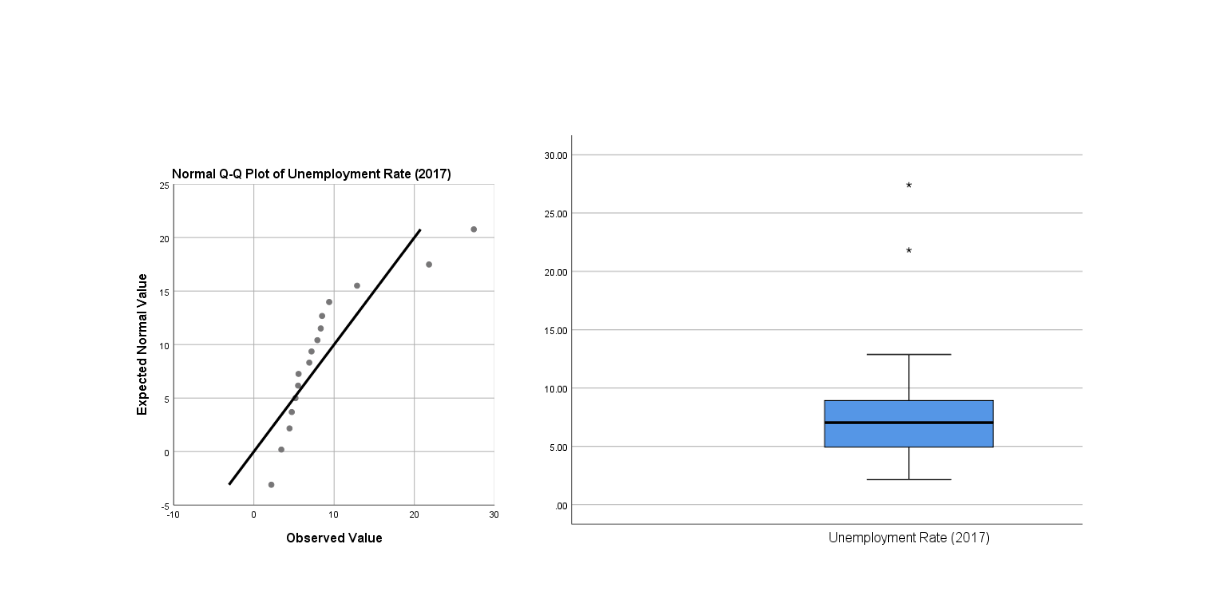

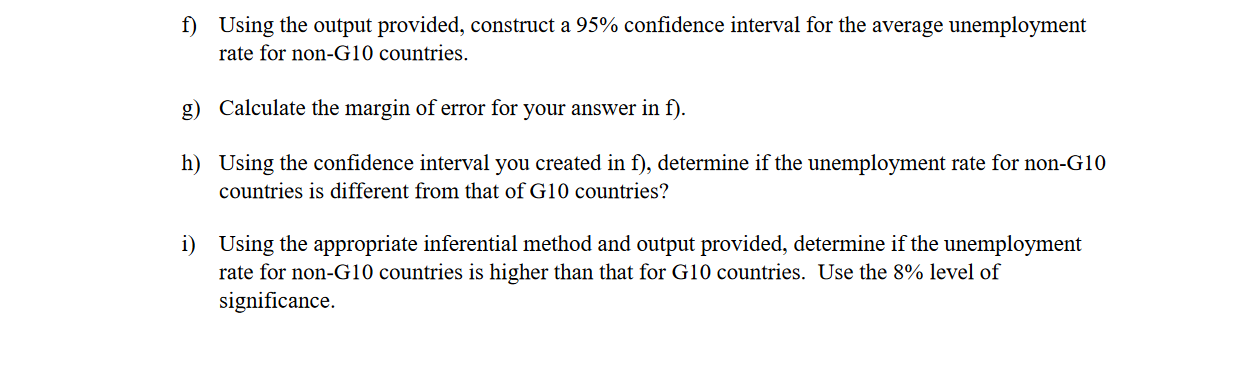
1. The Group of 10 (G10) countries is made up of eleven industrial countries which work together on economic, monetary and nancial matters (https:f/statscecd.org/glossaw/detail.asp?ID=7022). 3 (source: worldpopulace.com) The average unemployment rate for G10 countries is 5.92%. Using a sample of 16 countries, researchers want to determine if this rate is higher for non-610 counties than for 610 countries. You are presented with the following summary statistics, test results and graphs for analysis. (Data source: World Bank (20220920). Global Economic Monitor: Unemployment Rate, Seasonally Adjusted, 2017. Data PlanetTM Statistical Datasets: A SAGE Publishing Resource. (Dataset)) One-Sample Statistics Std. Error N Mean Std. Deviation Mean Unemployment Rate 16 8.8346 6.74762 1.68690 (2017) One-Sample Test Test Value = 5.92 95% Confidence Interval of the Mean Difference t df Sig. (2-tailed) Difference Lower Upper Unemployment Rate 1.728 15 105 2.91457 .6810 6.5101 (2017)30.00 Normal Q-Q Plot of Unemployment Rate (2017) 25 25.00 20 20.00 15 . . 15.00 Expected Normal Value 10 10.00 5 D 5.00 D 10 20 30 Observed Value Unemployment Rate (2017)f) Using the output provided, construct a 95% confidence interval for the average unemployment rate for non-G10 countries. g) Calculate the margin of error for your answer in f). h) Using the confidence interval you created in f), determine if the unemployment rate for non-G10 countries is different from that of G10 countries? i) Using the appropriate inferential method and output provided, determine if the unemployment rate for non-G10 countries is higher than that for G10 countries. Use the 8% level of significance
Step by Step Solution
There are 3 Steps involved in it

Get step-by-step solutions from verified subject matter experts