

Question: I would like some detailed step by step solution for the following Inference for One-Sample Population Means - Part 2 Exercise I only need the


I would like some detailed step by step solution for the following Inference for One-Sample Population Means - Part 2 Exercise
I only need the answer for part K

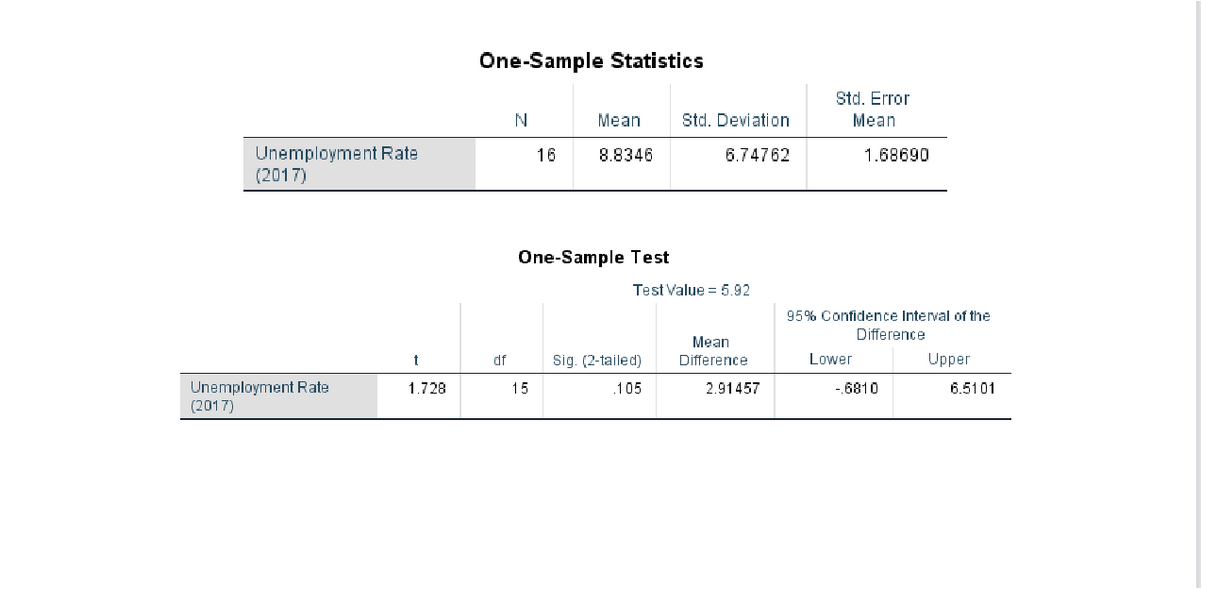

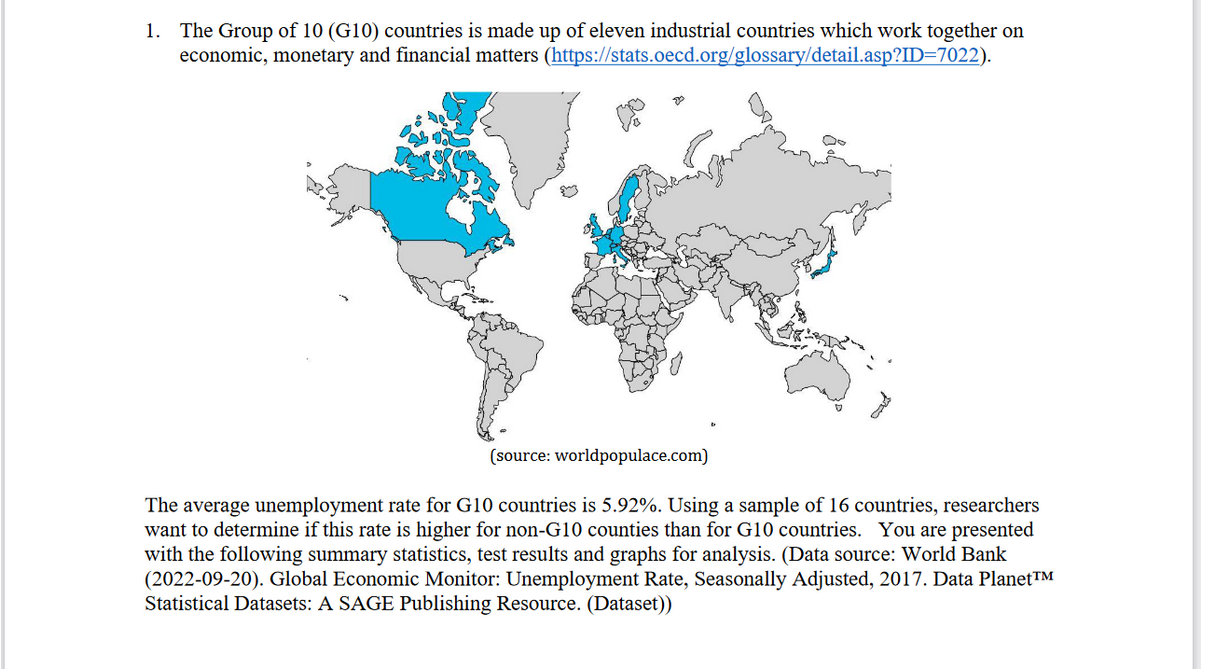
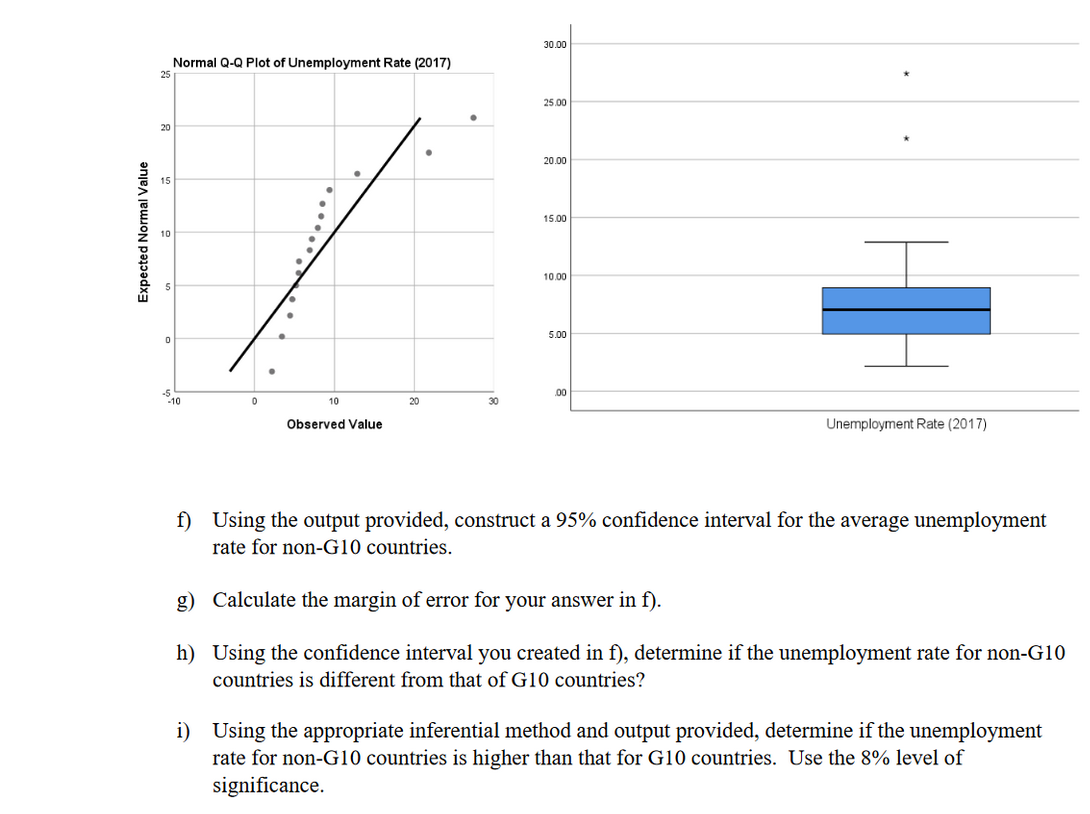
j) Given your results in i) should you calculate the effect size? Why? If yes, calculate the effect size and interpret your result. it) Using the information provided, do you have any reason to be concerned about the validity of your results? Give reasons for your answer. 1. The Group of 10 (G10) countries is made up of eleven industrial countries which work together on economic, monetary and financial matters (https://stats.oecd.org/glossary/detail.asp?ID=7022). (source: worldpopulace.com) The average unemployment rate for G10 countries is 5.92%. Using a sample of 16 countries, researchers want to determine if this rate is higher for non-G10 counties than for G10 countries. You are presented with the following summary statistics, test results and graphs for analysis. (Data source: World Bank (2022-09-20). Global Economic Monitor: Unemployment Rate, Seasonally Adjusted, 2017. Data PlanetTM Statistical Datasets: A SAGE Publishing Resource. (Dataset))One-Sample Statistics Std. Error N Mean Std. Deviation Mean Unemployment Rate 16 8.8346 6.74762 1.68690 (2017) One-Sample Test Test Value = 5.92 95% Confidence Interval of the Mean Difference t df Sig. (2-tailed) Difference Lower Upper Unemployment Rate 1.728 15 105 2.91457 -.6810 6.5101 (2017)30.00 Normal Q-Q Plot of Unemployment Rate (2017) 25 25.00 20 20.00 15 15.00 Expected Normal Value 10 w . . . . . 10.00 cn 5.00 00 10 20 Observed Value Unemployment Rate (2017) f) Using the output provided, construct a 95% confidence interval for the average unemployment rate for non-G10 countries. g) Calculate the margin of error for your answer in f). h) Using the confidence interval you created in f), determine if the unemployment rate for non-G10 countries is different from that of G10 countries? i) Using the appropriate inferential method and output provided, determine if the unemployment rate for non-G10 countries is higher than that for G10 countries. Use the 8% level of significance
Step by Step Solution
There are 3 Steps involved in it

Get step-by-step solutions from verified subject matter experts