

Question: I would like to make an histogram with defined bin using data analysis tool. But I get an error message. Could you please help? AutoSave
I would like to make an histogram with defined bin using data analysis tool. But I get an error message. Could you please help?
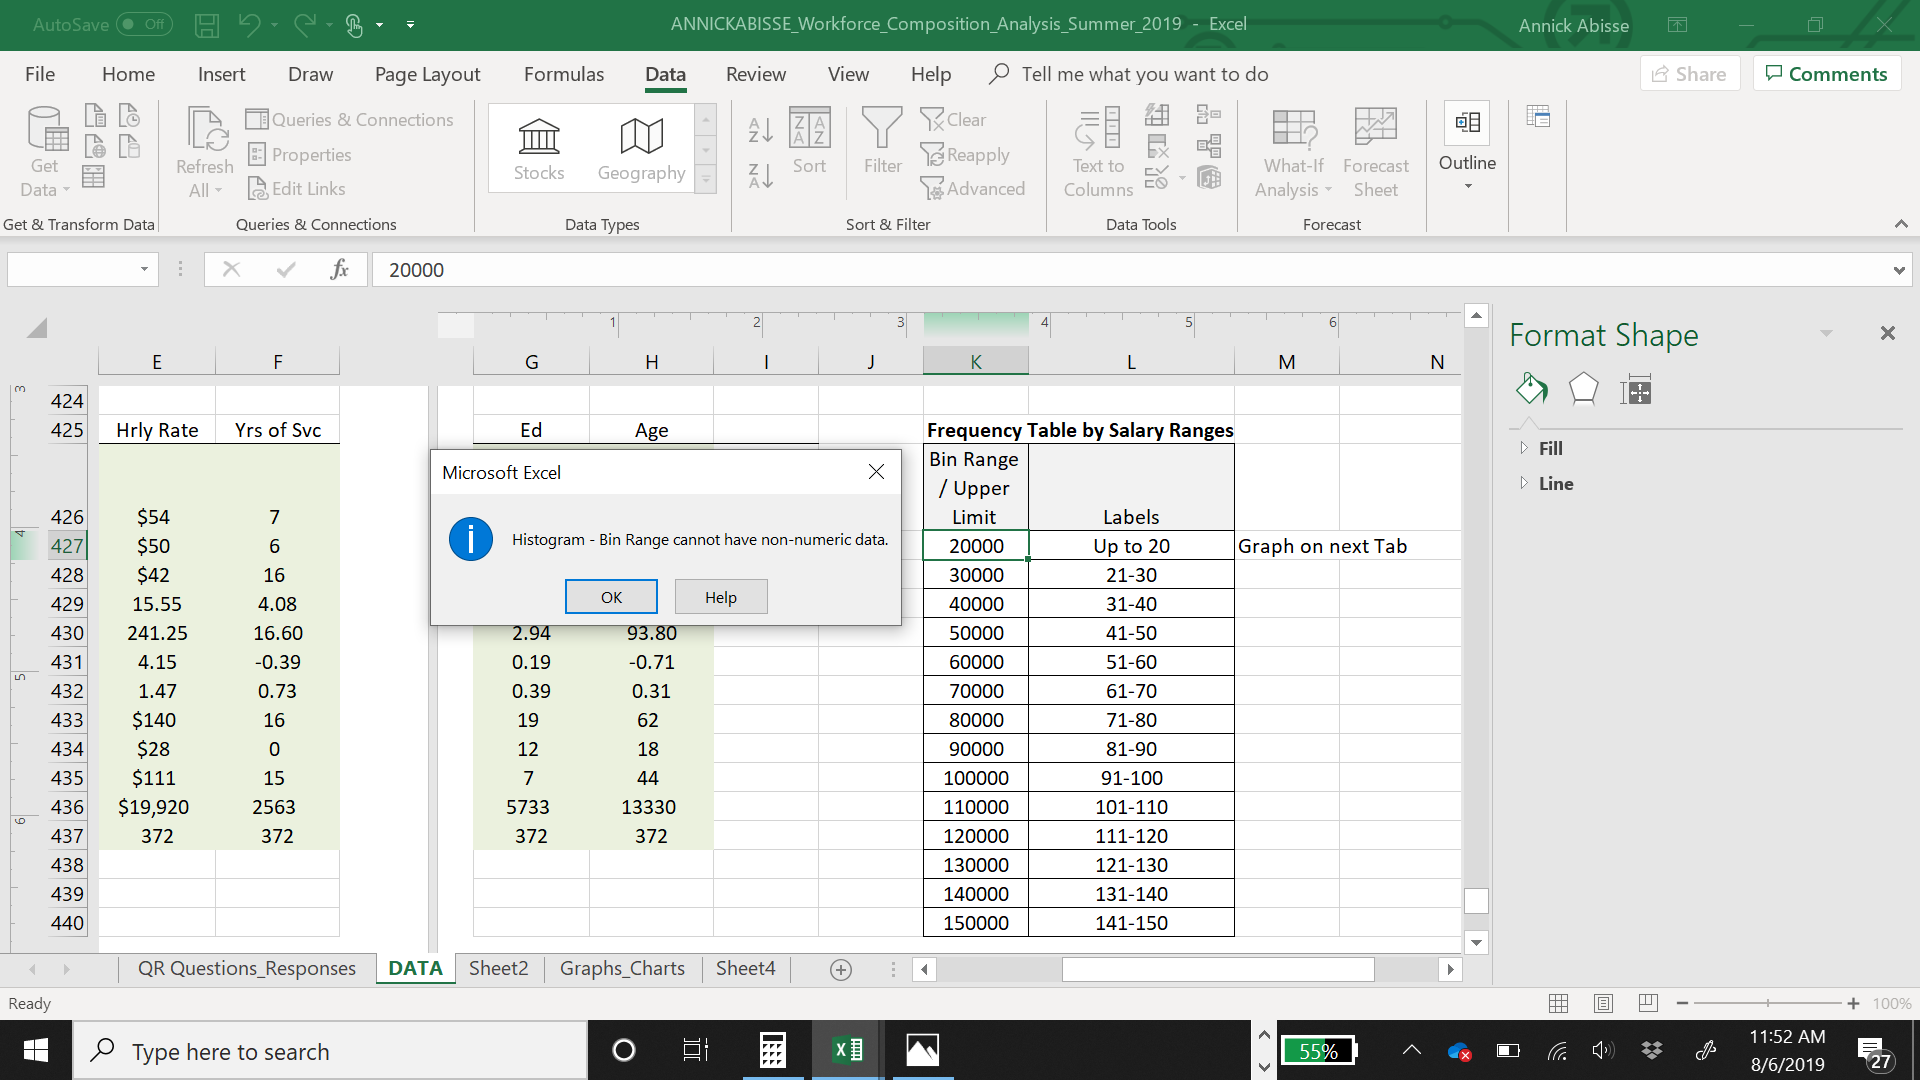
AutoSave (. Off) H ANNICKABISSE_Workforce_Composition_Analysis_Summer_2019 - Excel Annick Abisse File Home Insert Draw Page Layout Formulas Data Review View Help Tell me what you want to do Share Comments Queries & Connections P & Clear GH Get Refresh Properties Stocks Geography Sort Filter Reapply Text to What-If Forecast Data Edit Links Advanced CV Outline All Columns Analysis * Sheet Get & Transform Data Queries & Connections Data Types Sort & Filter Data Tools Forecast X v fx 20000 N 3 5 6 Format Shape X E F G H K M N 424 425 Hrly Rate Yrs of Svc Ed Age Frequency Table by Salary Ranges Bin Range D Fill Microsoft Excel X / Upper Line 426 $54 7 Limit Labels 427 $50 Histogram - Bin Range cannot have non-numeric data. 20000 Up to 20 Graph on next Tab 428 $42 16 30000 21-30 429 15.55 4.08 OK Help 40000 31-40 430 241.25 16.60 2.94 93.80 50000 41-50 431 4.15 -0.39 0.19 -0.71 50000 51-60 432 1.47 0.73 0.39 0.31 70000 61-70 433 $140 16 19 62 80000 71-80 434 $28 0 12 18 90000 81-90 435 $111 15 7 44 100000 91-100 436 $19,920 2563 5733 13330 110000 101-110 437 372 372 372 372 120000 111-120 438 130000 121-130 439 140000 131-140 440 150000 141-150 QR Questions_Responses DATA Sheet2 Graphs_Charts Sheet4 + Ready - + 100% Type here to search O x O calls 11:52 AM 8/6/2019 27
Step by Step Solution
There are 3 Steps involved in it

Get step-by-step solutions from verified subject matter experts