

Question: I wrote a program to read in a CSV file and calculate the mean, standard deviation, min and max values of each column and stored
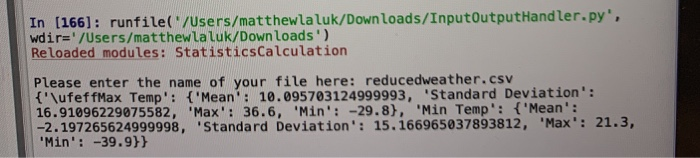
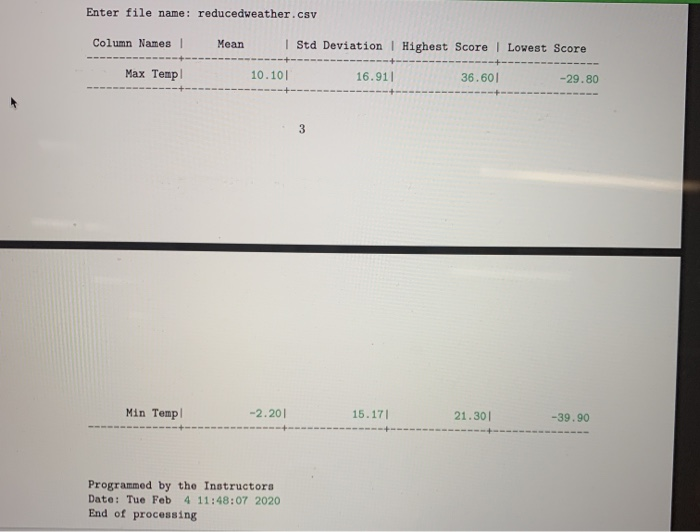

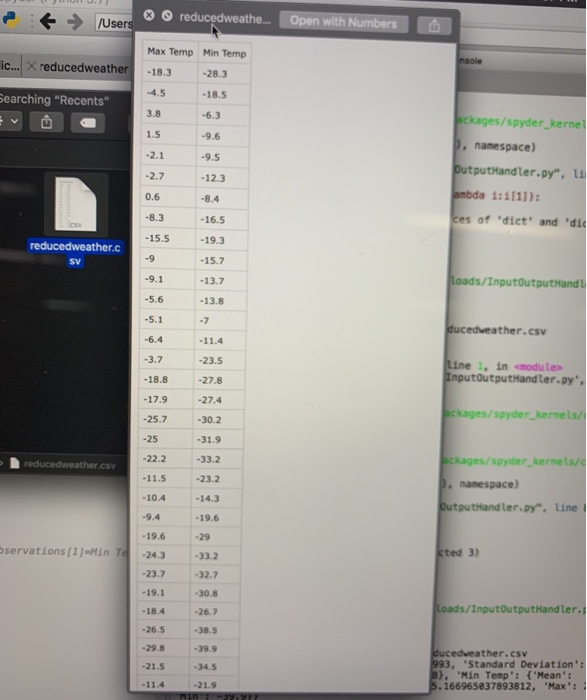
In (166): runfile('/Users/matthewlaluk/Downloads/InputOutputHandler.py', wdir='/Users/matthewlaluk/Downloads) Reloaded modules: StatisticsCalculation Please enter the name of your file here: reducedweather.CSV {"\ufeffMax Temp': {'Mean': 10.095703124999993, Standard Deviation': 16.91096229075582, 'Max': 36.6, 'Min': -29.8), "Min Temp': {'Mean': -2.197265624999998, 'Standard Deviation': 15.166965037893812, "Max: 21.3, "Min': -39.9}} Enter file name: reducedweather.csv Column Names Mean Std Deviation | Highest Score | Lowest Score Max Temp 10.101 16.911 36.601 -29.80 Min Temp Min Temp -2.201_ -2.201 15.17 15.171 21.301 21.301 -39.90 -39.90 Programmed by the Instructors Date: Tue Feb 4 11:48:07 2020 End of processing openFile = open(fileName) headings = openFile.readLine().strip().split(",") e t /Users * reducedweathe... Open with Numbers Max Temp Min Temp ic... X reducedweather -18.3 -28.3 -4.5 Searching "Recents" -18.5 -6.3 -9.6 hckages/spyder_kernel p, namespace) OutputHandler.py", ti ambda 1:1[1]): ces of "dict' and 'di -12.3 -16.5 reducedweather.c -13.7 loads/InputOutputHandl -13.8 ducedweather.csv -6.4 -11.4 -3.7 -23.5 Line 1, in modul InputOutputHandler.py". -18.8 - 17.9 -25.7 -27.8 -27.4 -30.2 -31.9 -33.2 ackages/spyder_kernels reduced weather.csv bckages/spyder kernels/ p. namespace) Outputhandler.py", line - 10.4 -9.4 bservations [1]=Min To -19.6 -24.3 -23.7 sted 3) - 19.1 -18.4 Loads/Input OutputHandler. -26.7 -38.5 -26.5 -29.8 -21.5 -34.5 ducedweather.csv 993, "Standard Deviation: 8}, "Min Temp': {'Mean': 5.166965837893812, "Max
Step by Step Solution
There are 3 Steps involved in it

Get step-by-step solutions from verified subject matter experts