

Question: Step 1 - Creating a module of functions for computing statistics As a first step, create a module with name StatisticsCalculation. To create the module,
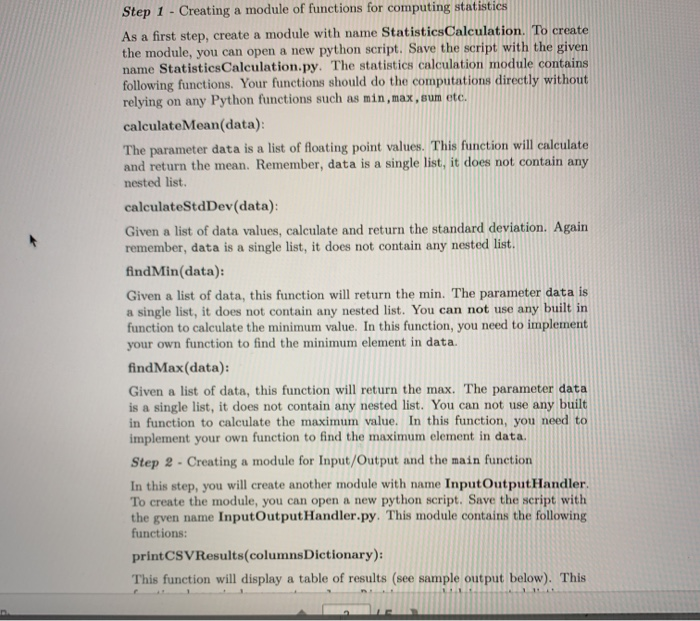
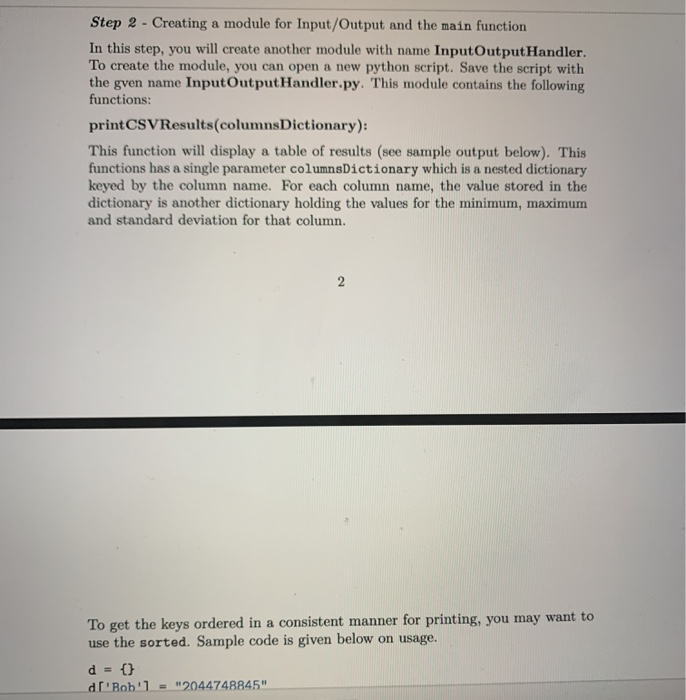
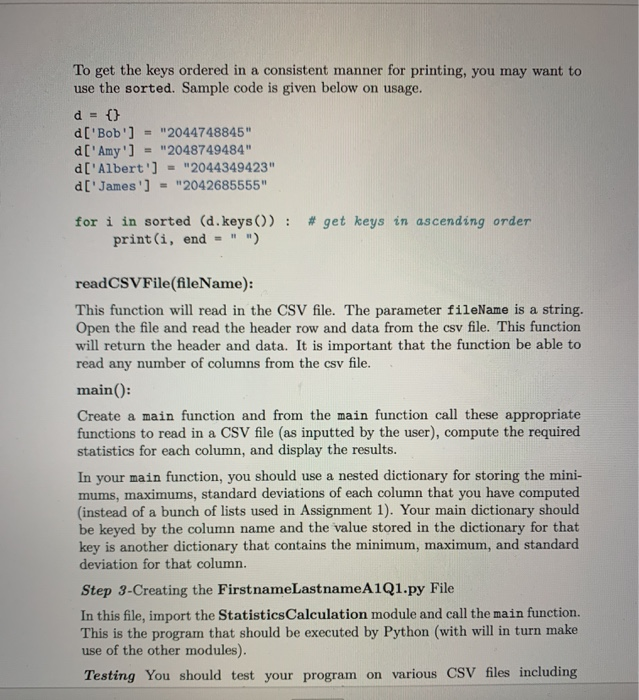
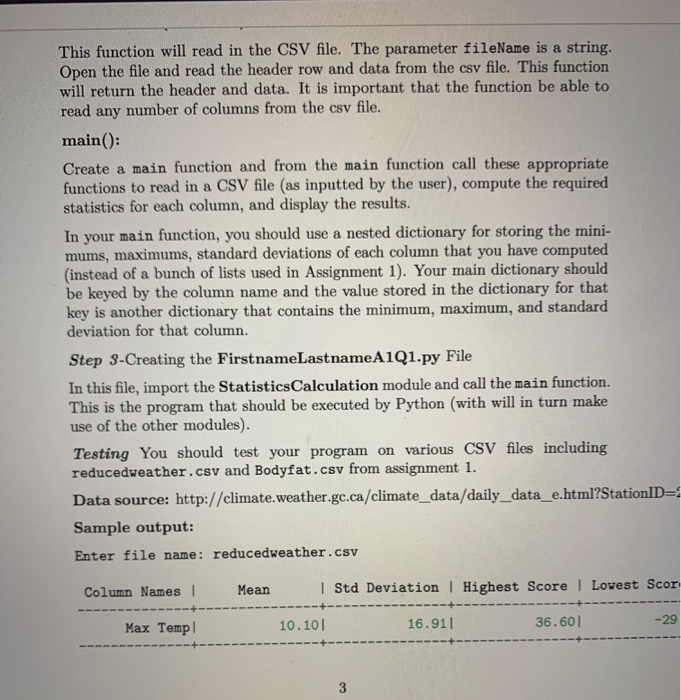
Step 1 - Creating a module of functions for computing statistics As a first step, create a module with name StatisticsCalculation. To create the module, you can open a new python script. Save the script with the given name StatisticsCalculation.py. The statistics calculation module contains following functions. Your functions should do the computations directly without relying on any Python functions such as min, max, sum etc. calculate Mean(data): The parameter data is a list of floating point values. This function will calculate and return the mean. Remember, data is a single list, it does not contain any nested list. calculateStdDev(data): Given a list of data values, calculate and return the standard deviation. Again remember, data is a single list, it does not contain any nested list. findMin(data): Given a list of data, this function will return the min. The parameter data is a single list, it does not contain any nested list. You can not use any built in function to calculate the minimum value. In this function, you need to implement your own function to find the minimum element in data. findMax(data): Given a list of data, this function will return the max. The parameter data is a single list, it does not contain any nested list. You can not use any built in function to calculate the maximum value. In this function, you need to implement your own function to find the maximum element in data. Step 2 - Creating a module for Input/Output and the main function In this step, you will create another module with name Input OutputHandler To create the module, you can open a new python script. Save the script with the gven name InputOutputHandler.py. This module contains the following functions: printCSV Results(columns Dictionary): This function will display a table of results (see sample output below). This Step 2 - Creating a module for Input/Output and the main function In this step, you will create another module with name InputOutputHandler. To create the module, you can open a new python script. Save the script with the gven name InputOutputHandler.py. This module contains the following functions: printCSVResults(columns Dictionary): This function will display a table of results (see sample output below). This functions has a single parameter columns Dictionary which is a nested dictionary keyed by the column name. For each column name, the value stored in the dictionary is another dictionary holding the values for the minimum, maximum and standard deviation for that column. To get the keys ordered in a consistent manner for printing, you may want to use the sorted. Sample code is given below on usage. d = {} d'Bob'] = "2044748845" To get the keys ordered in a consistent manner for printing, you may want to use the sorted. Sample code is given below on usage. d = {} d['Bob'] = "2044748845" d['Amy'] = "2048749484" d['Albert'] = "2044349423" d['James'] = "2042685555" for i in sorted (d.keys()) : # get keys in ascending order print(i, end = "") readCSVFile(fileName): This function will read in the CSV file. The parameter fileName is a string. Open the file and read the header row and data from the csv file. This function will return the header and data. It is important that the function be able to read any number of columns from the csv file. main(): Create a main function and from the main function call these appropriate functions to read in a CSV file (as inputted by the user), compute the required statistics for each column, and display the results. In your main function, you should use a nested dictionary for storing the mini- mums, maximums, standard deviations of each column that you have computed (instead of a bunch of lists used in Assignment 1). Your main dictionary should be keyed by the column name and the value stored in the dictionary for that key is another dictionary that contains the minimum, maximum, and standard deviation for that column. Step 3-Creating the First nameLastnameA1Q1.py File In this file, import the StatisticsCalculation module and call the main function. This is the program that should be executed by Python (with will in turn make use of the other modules). Testing You should test your program on various CSV files including This function will read in the CSV file. The parameter fileName is a string. Open the file and read the header row and data from the csv file. This function will return the header and data. It is important that the function be able to read any number of columns from the csv file. main(): Create a main function and from the main function call these appropriate functions to read in a CSV file (as inputted by the user), compute the required statistics for each column, and display the results. In your main function, you should use a nested dictionary for storing the mini- mums, maximums, standard deviations of each column that you have computed (instead of a bunch of lists used in Assignment 1). Your main dictionary should be keyed by the column name and the value stored in the dictionary for that key is another dictionary that contains the minimum, maximum, and standard deviation for that column. Step 3-Creating the First nameLastname A101.py File In this file, import the StatisticsCalculation module and call the main function. This is the program that should be executed by Python (with will in turn make use of the other modules). Testing You should test your program on various CSV files including reducedweather.csv and Bodyfat.csv from assignment 1. Data source: http://climate.weather.gc.ca/climate_data/daily_data_e.html?StationID= Sample output: Enter file name: reducedweather.csv Column Names I Mean I Std Deviation | Highest Score 1 Lowest Scor Max Templ 10.10 16.911 36.601 -29
Step by Step Solution
There are 3 Steps involved in it

Get step-by-step solutions from verified subject matter experts