

Question: ID Control Limit2 Using Sample LCL is: 21.818.915.60.0 QUESTION 5 ID Control Limit3 Using Sample Which sample is out of control and over UCL? sample
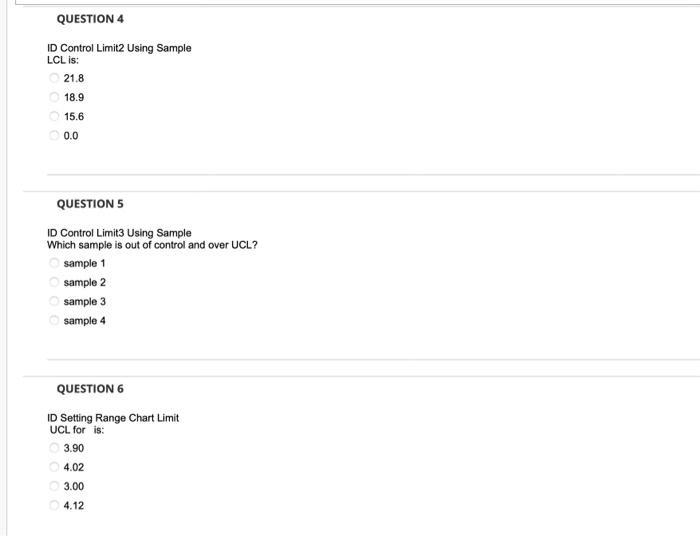
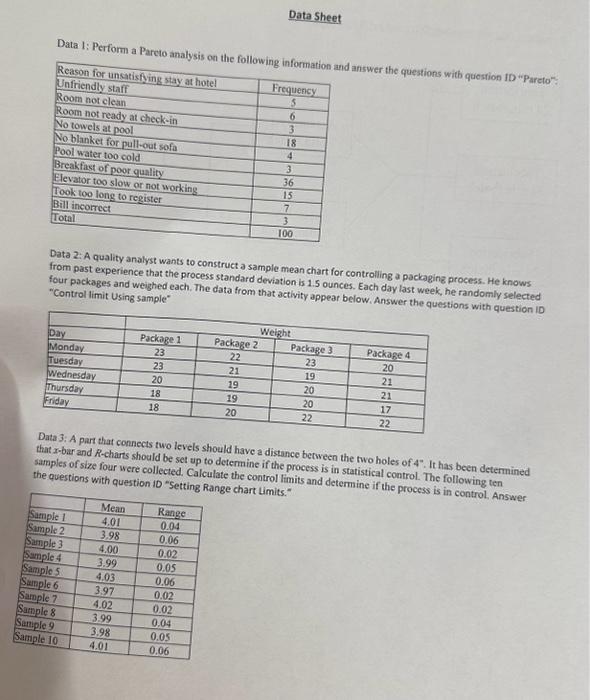
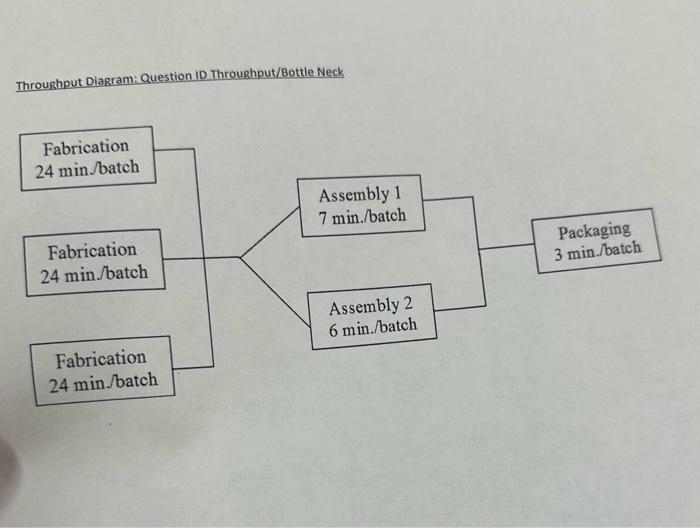
ID Control Limit2 Using Sample LCL is: 21.818.915.60.0 QUESTION 5 ID Control Limit3 Using Sample Which sample is out of control and over UCL? sample 1 sample 2 sample 3 sample 4 QUESTION 6 ID Setting Range Chart Limit UCL for is: 3.904.023.00 4.12 Data 1: Perform a Pareto analuei............ Ad answer the questions with question ID "Pareto": Data 2: A quality analyst wants to construct a sample mean chart for controlling a packaging process. He knows four packages and we that the process standard deviation is 1.5 ounces. Each day last week, he randomly selected "Control limit Using sample" Data 3: A part that connects two levels should have a distance between the two holes of 4. It has been determined that x-bar and R-charts should be set up to determine if the process is in statistical control. The following ten the questions with question id " setting Range chantrol limits and determine if the process is in control. Answer Throughput Diagram: Question ID Throughput/Bottle Neck
Step by Step Solution
There are 3 Steps involved in it

Get step-by-step solutions from verified subject matter experts