Question: Using the same data on Covid-19 test collected in the previous question, a statistical process control chart was used for this purpose as shown here.
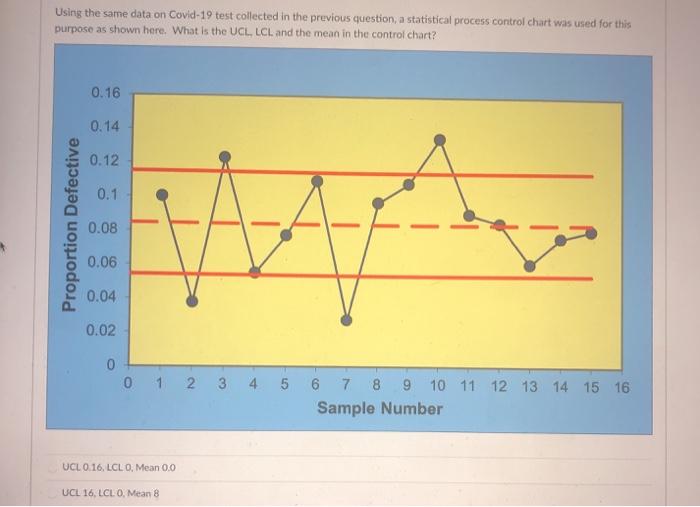
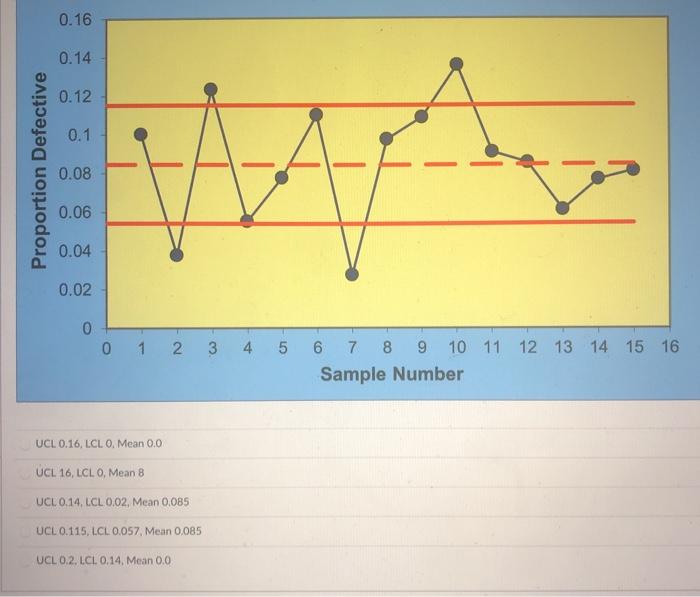
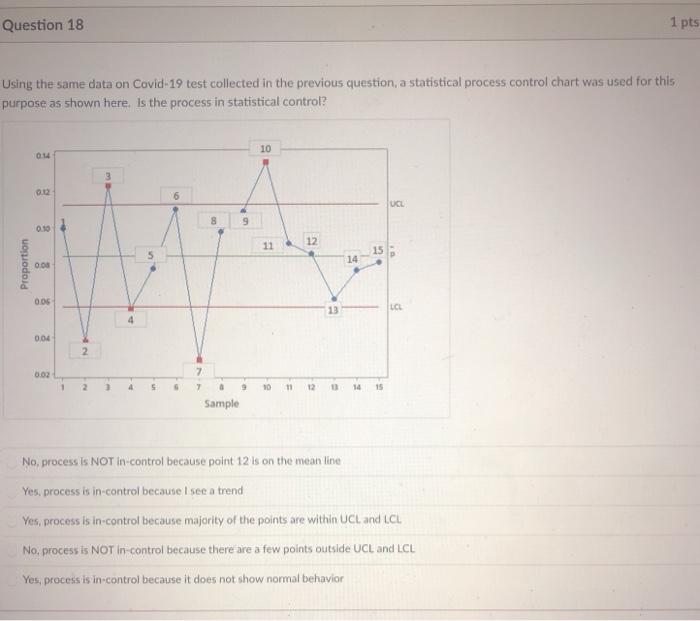
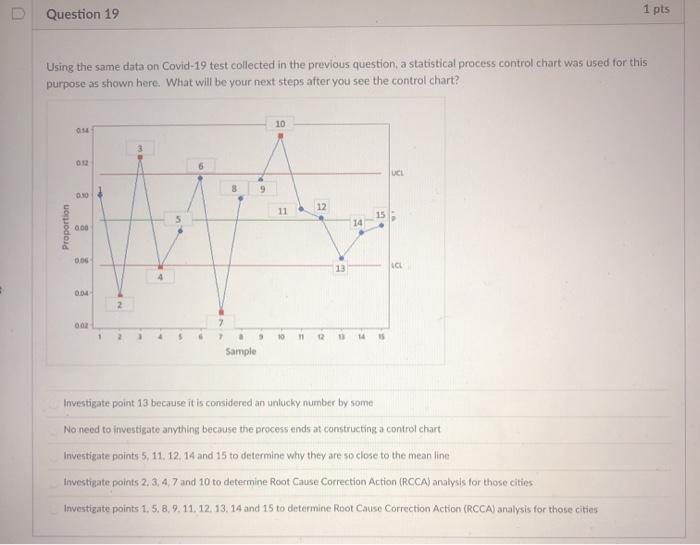
Using the same data on Covid-19 test collected in the previous question, a statistical process control chart was used for this purpose as shown here. What is the UCL, LCL and the mean in the control chart? 0.16 0.14 0.12 0.1 Proportion Defective 0.08 0.06 0.04 0.02 0 012 3 3 4 5 15 16 6 7 8 9 10 11 12 13 14 Sample Number UCL 0.16, LCLO, Mean 0.0 UCL 16, LCLO, Mean 8 0.16 0.14 0.12 0.1 Proportion Defective 0.08 0.06 0.04 0.02 0 0 1 2. 3 4 5 LO 15 16 6 7 8 9 10 11 12 13 14 Sample Number UCL 0.16, LCL O. Mean 0.0 UCL 16, LCLO, Mean 8 UCL 0.14, LCL 0.02. Mean 0.085 UCL 0.115, LCL 0.057, Mean 0,085 UCL 0.2. LCL 0.14. Mean 0.0 Question 18 1 pts Using the same data on Covid-19 test collected in the previous question, a statistical process control chart was used for this purpose as shown here. Is the process in statistical control? 10 014 6 UCL 8 9 0.10 11 12 15 14 Proportion . 0.00 DOS LC 4 0.04 2 0.02 7 1 2 4 7 9 10 11 12 14 15 Sample No process is NOT in-control because point 12 is on the mean line Yes, process is in control because I see a trend Yes, process is in control because majority of the points are within UCL and LCL No, process is NOT in-control because there are a few points outside UCL and LCL Yes, process is in control because it does not show normal behavior Question 19 1 pts Using the same data on Covid-19 test collected in the previous question, a statistical process control chart was used for this purpose as shown here. What will be your next steps after you see the control chart? 10 044 012 6 UCE 9 010 11 12 15 5 Proportion 0.00 14 00 13 LCL 2 2 11 12 1 14 15 Sample Investigate point 13 because it is considered an unlucky number by some No need to investigate anything because the process ends at constructing a control chart Investigate points 5, 11, 12, 14 and 15 to determine why they are so close to the mean line Investigate points 2, 3, 4 7 and 10 to determine Root Cause Correction Action (RCCA) analysis for those cities Investigate points 1.5.8.9. 11. 12. 13. 14 and 15 to determine Root Cause Correction Action (RCCA) analysis for those cities