

Question: Idehtzx the choice that best completes the statement or answers the question. Figure 15-11 50 100 150 200 250 300 350 400 450 500 550
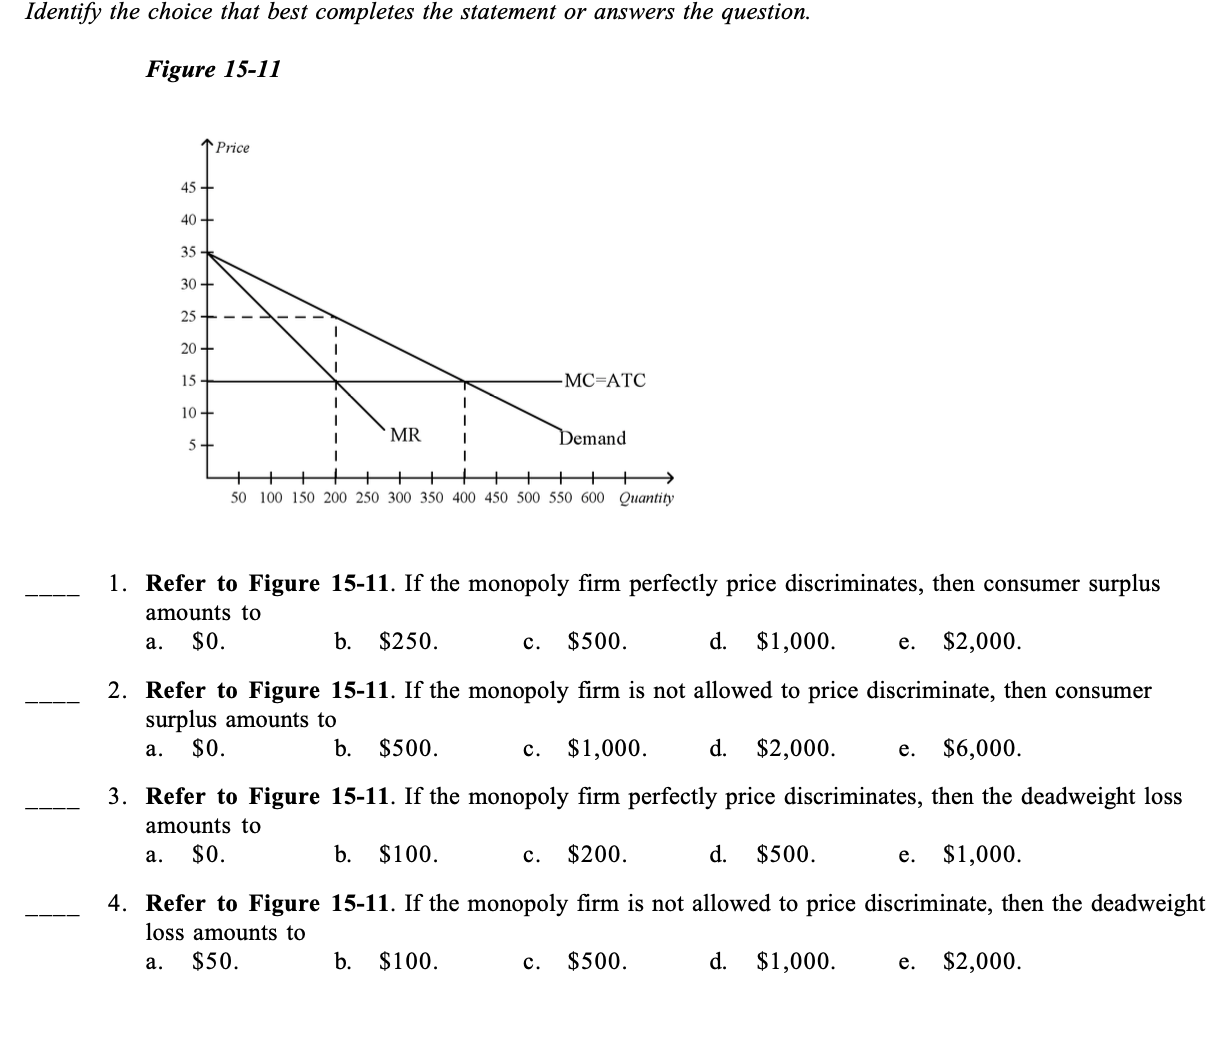
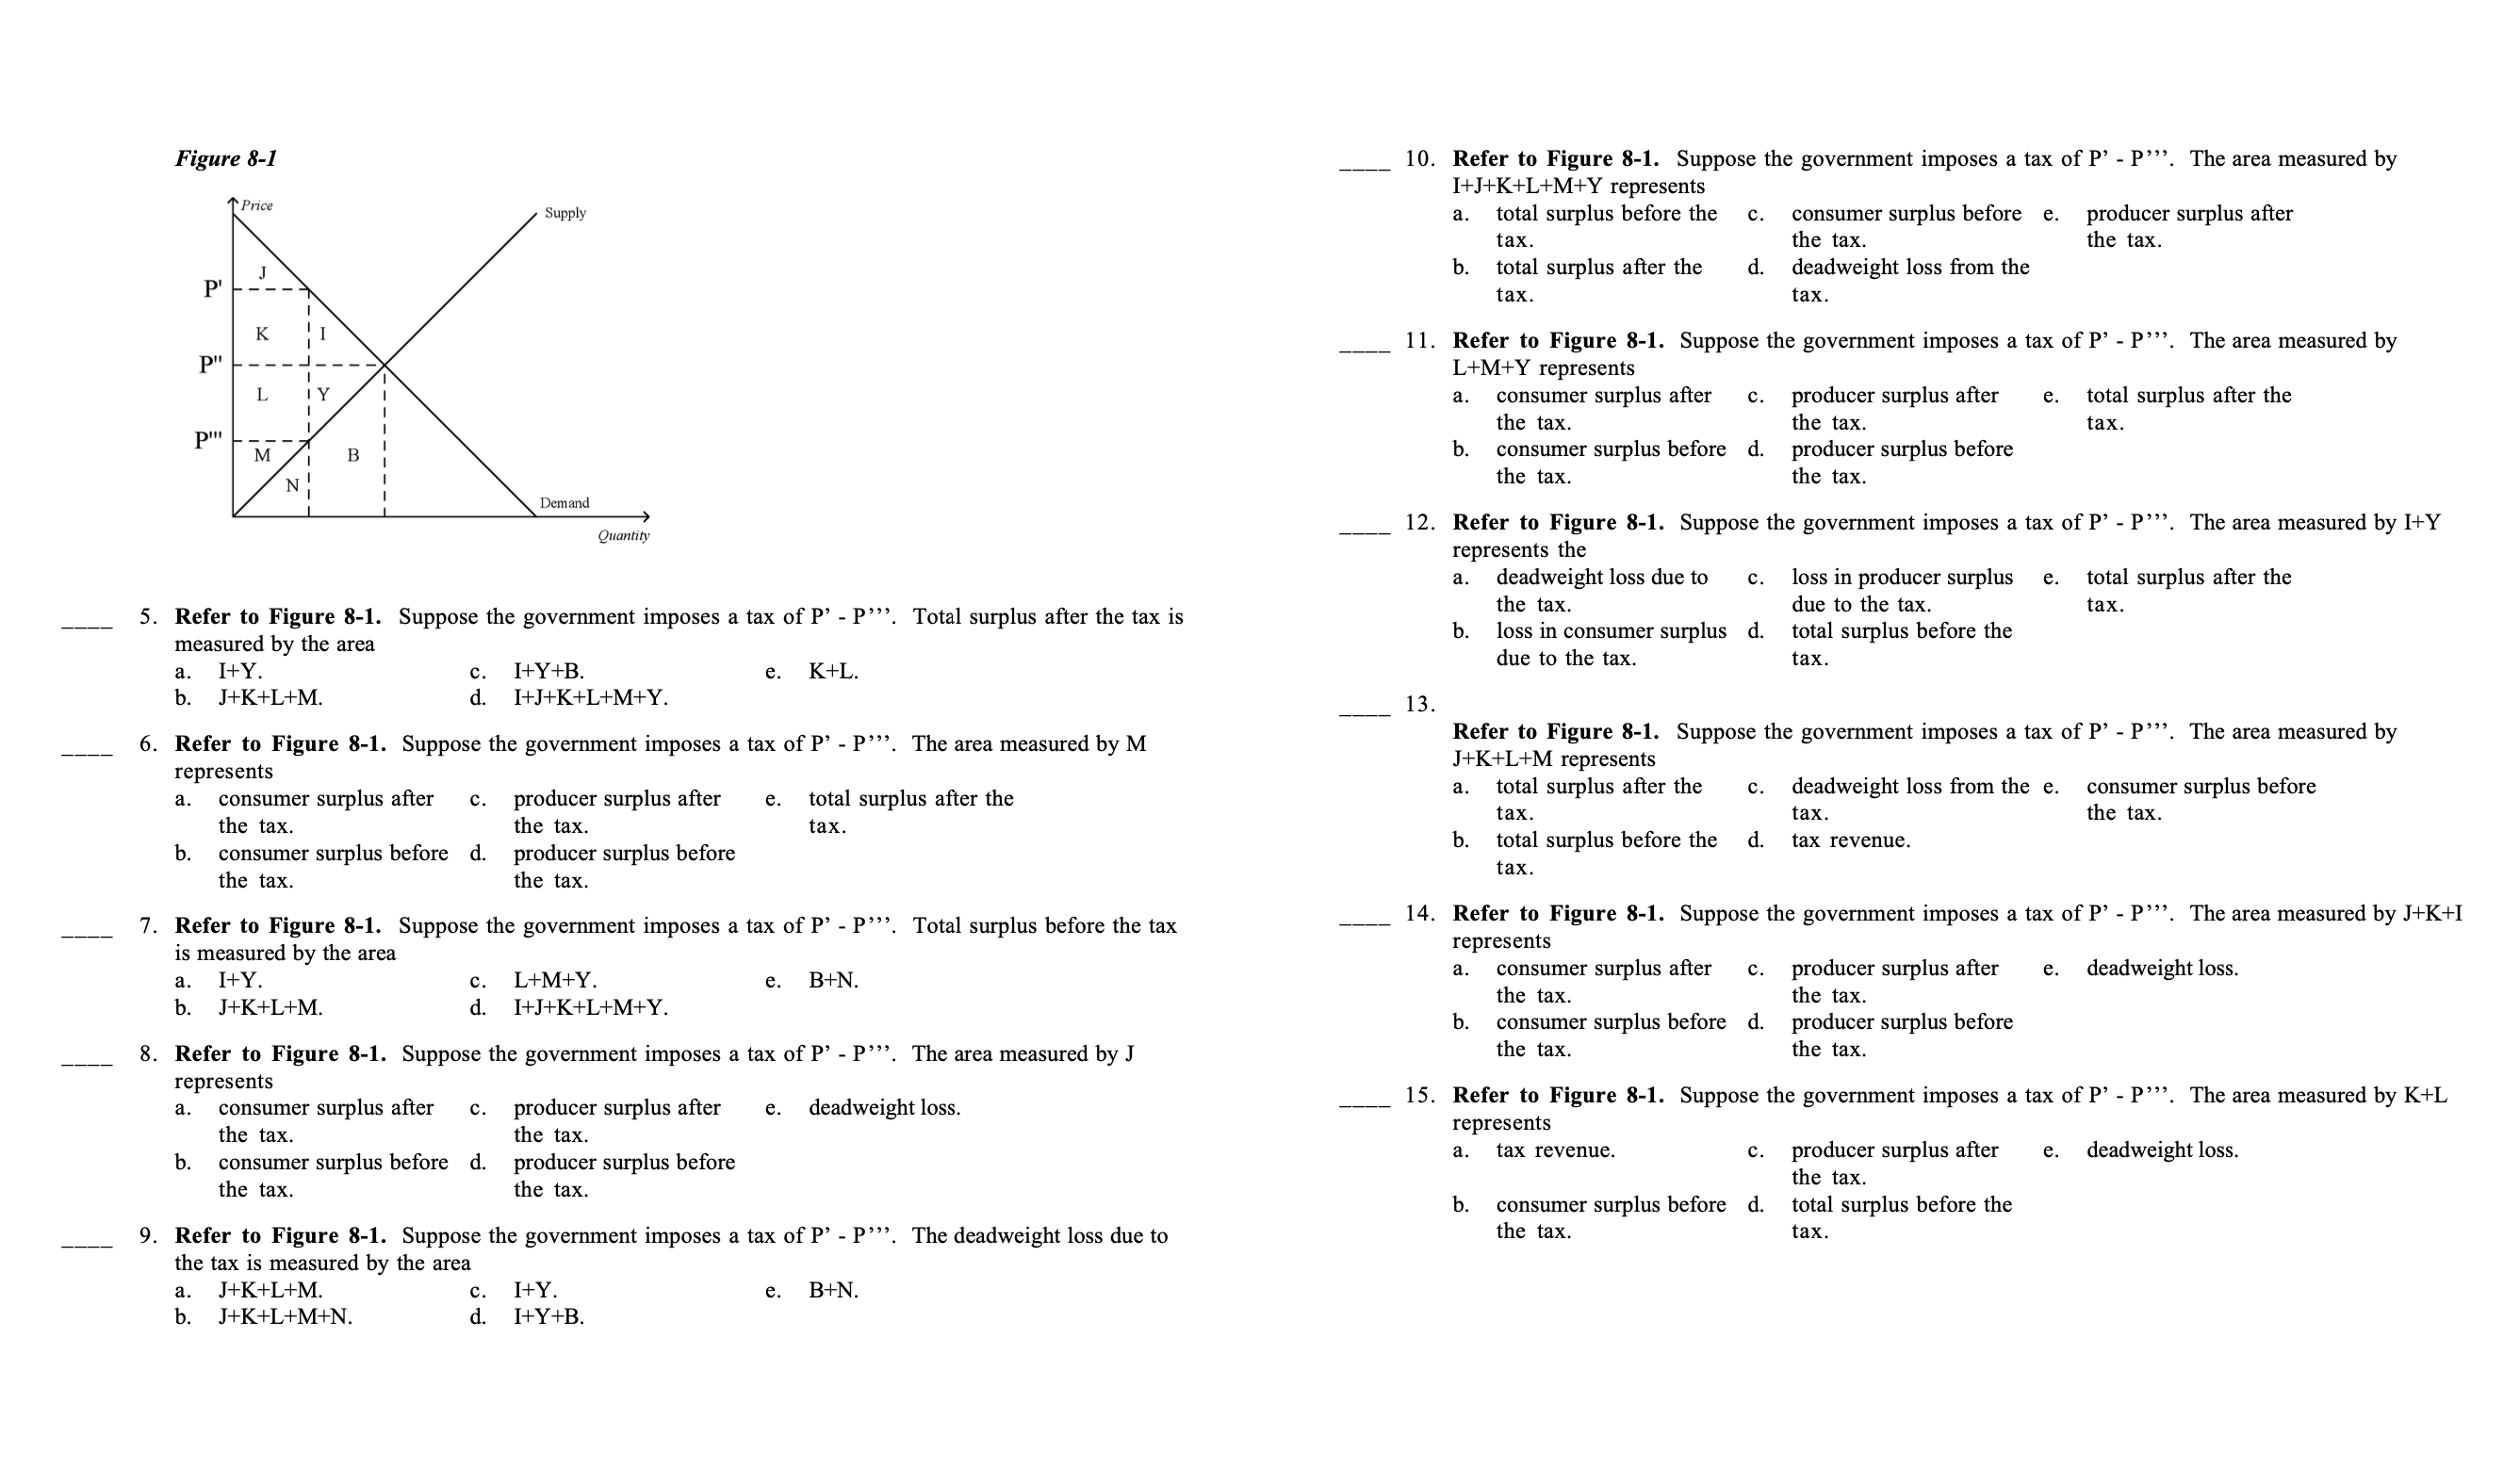
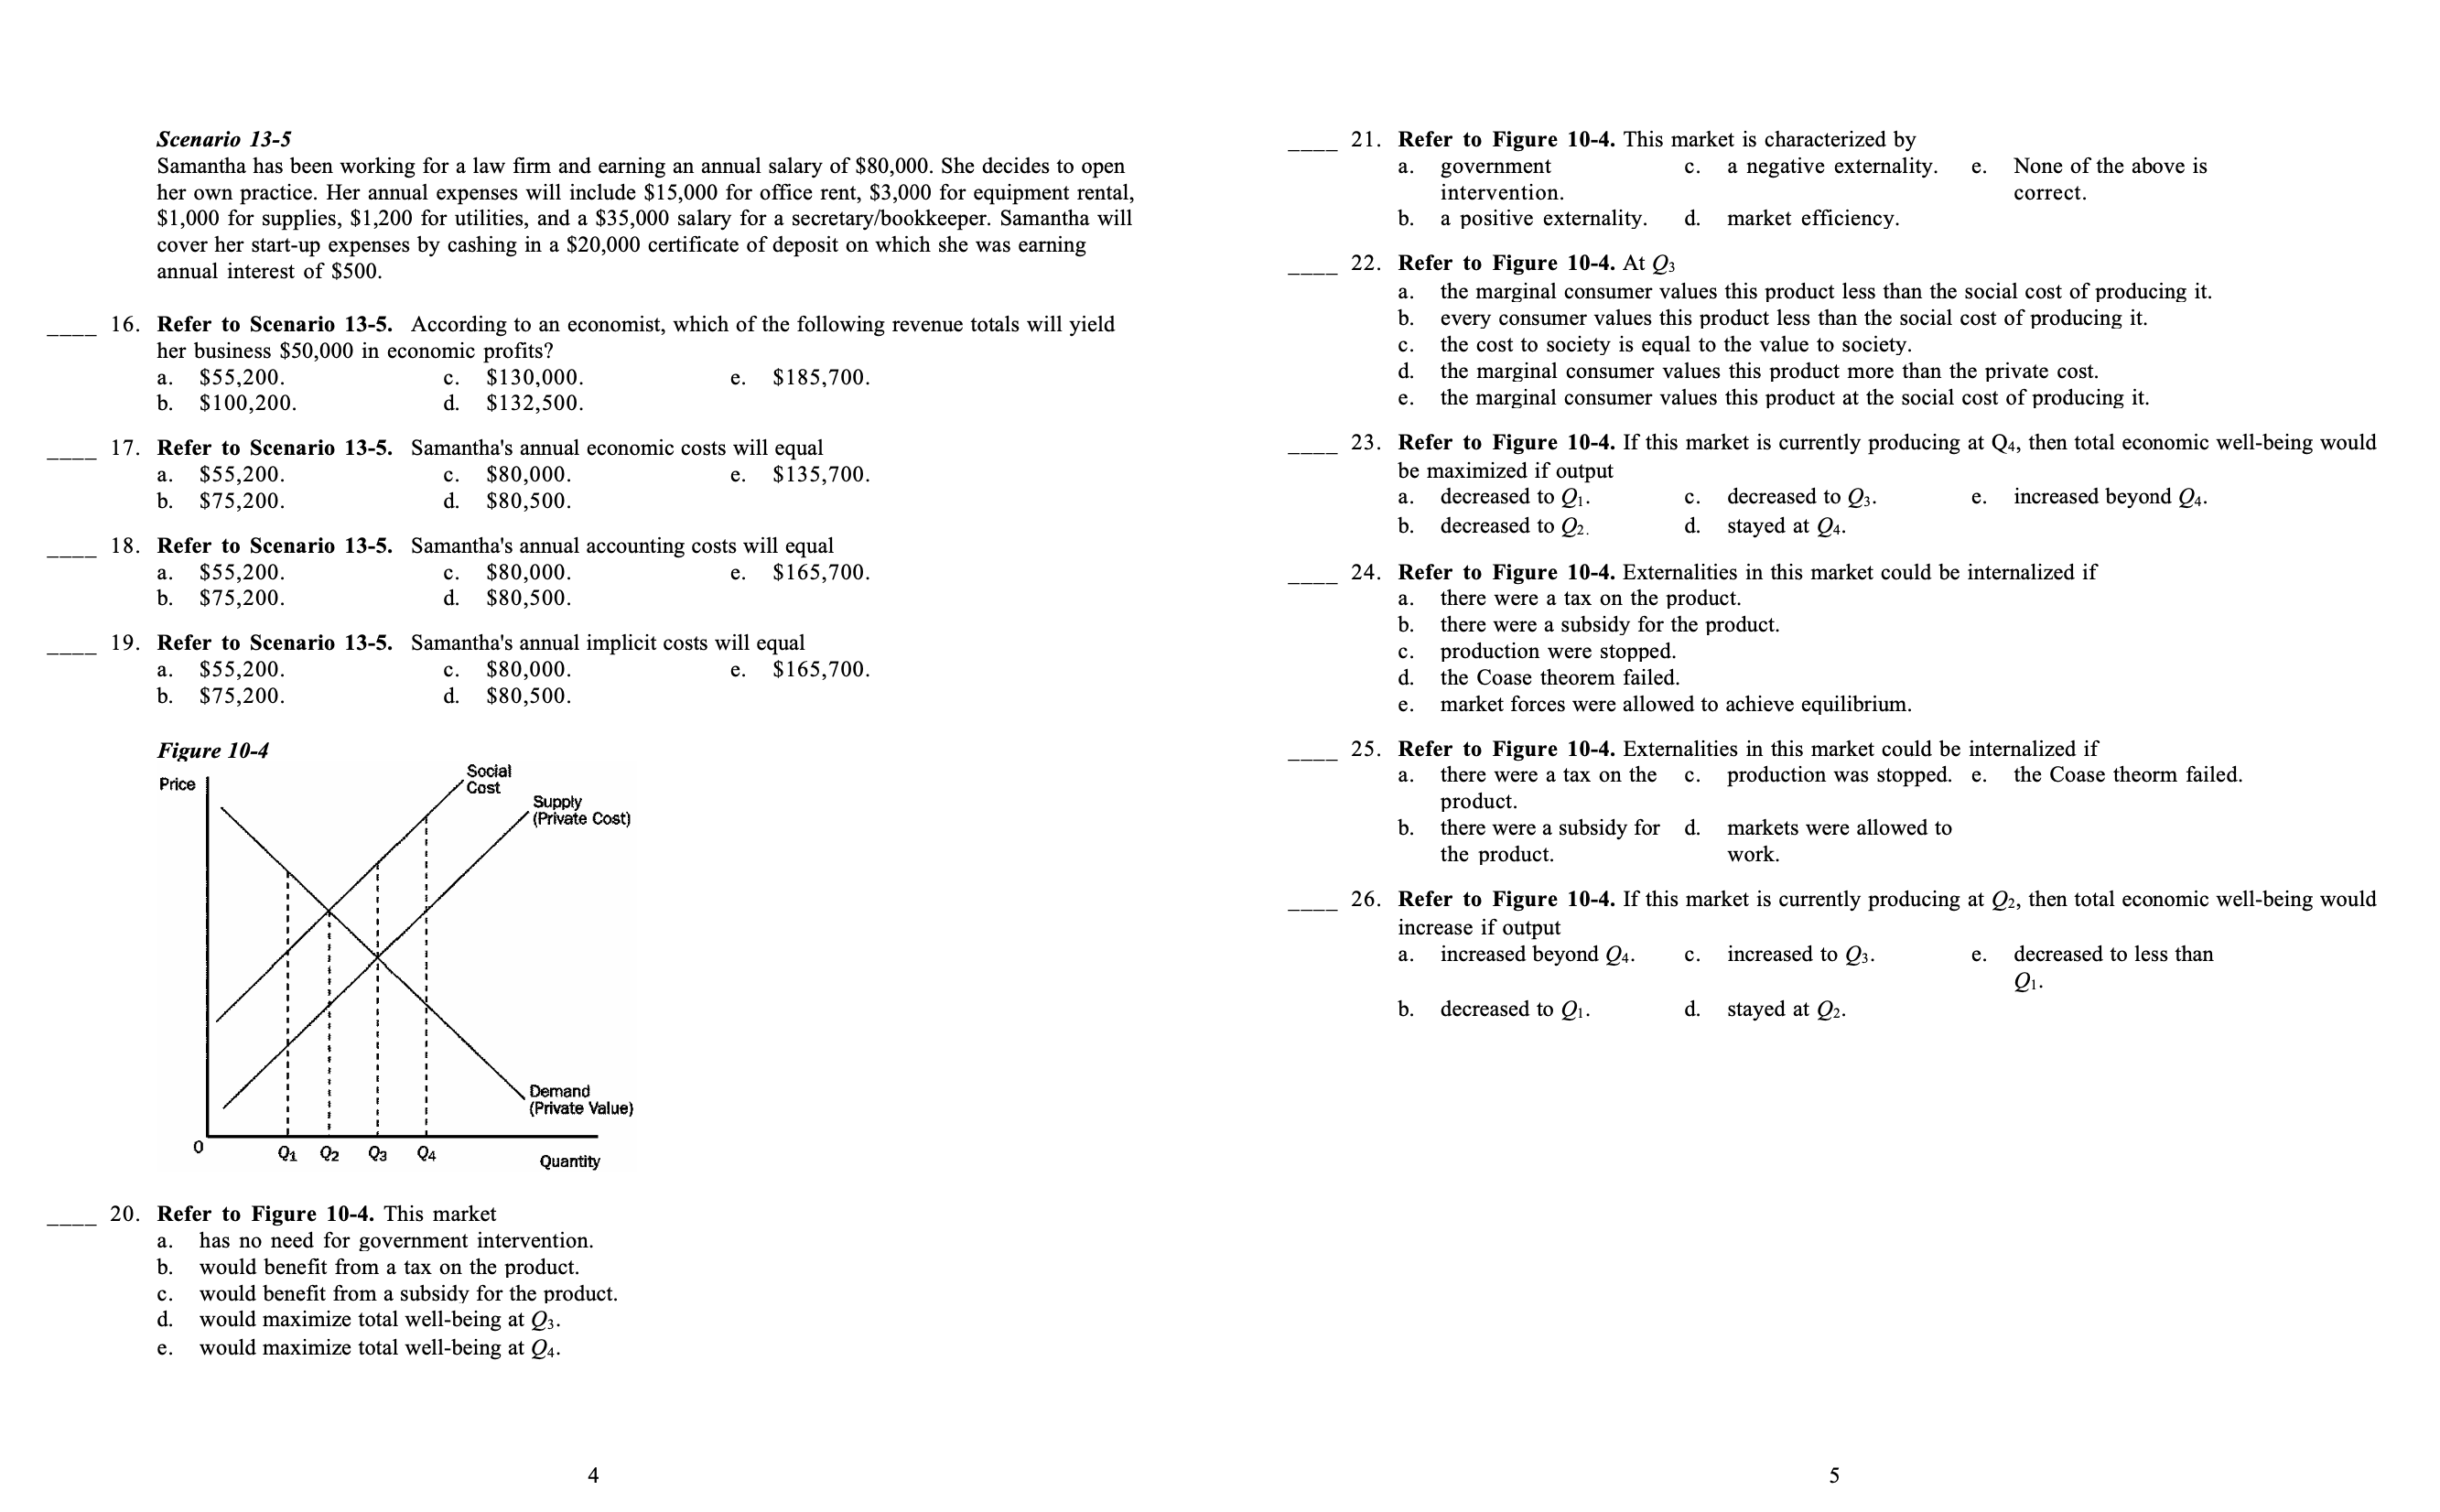
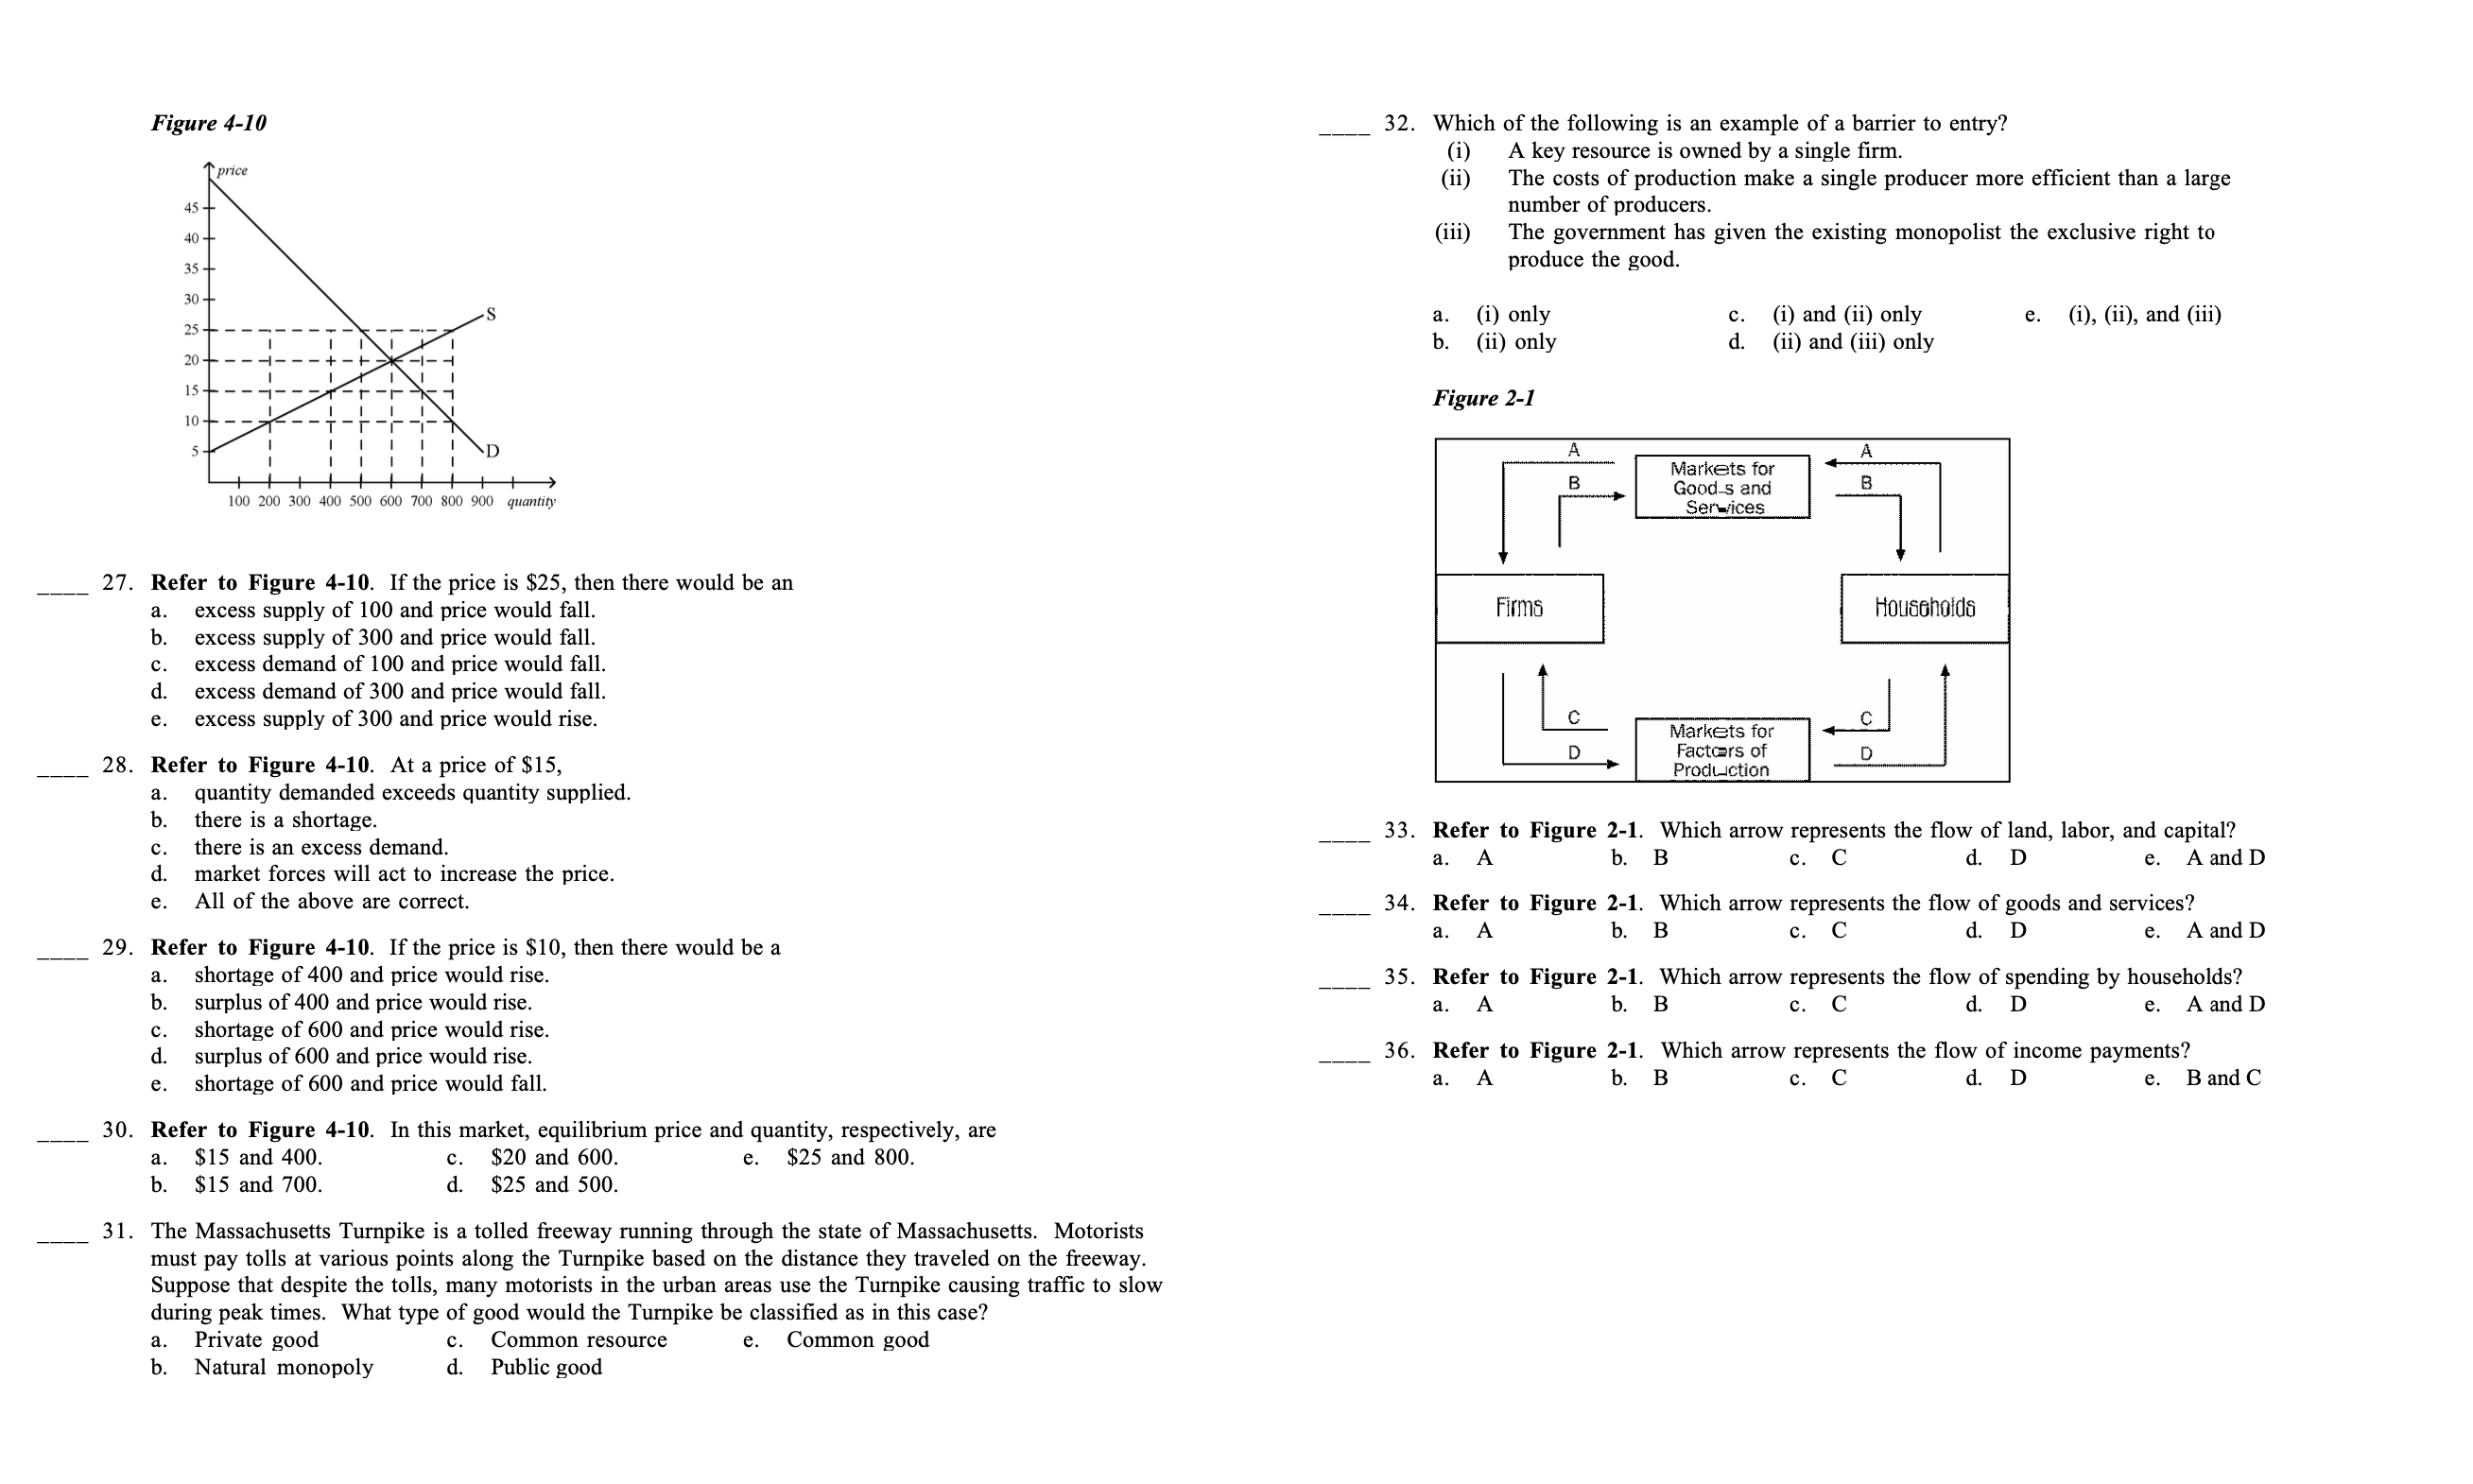
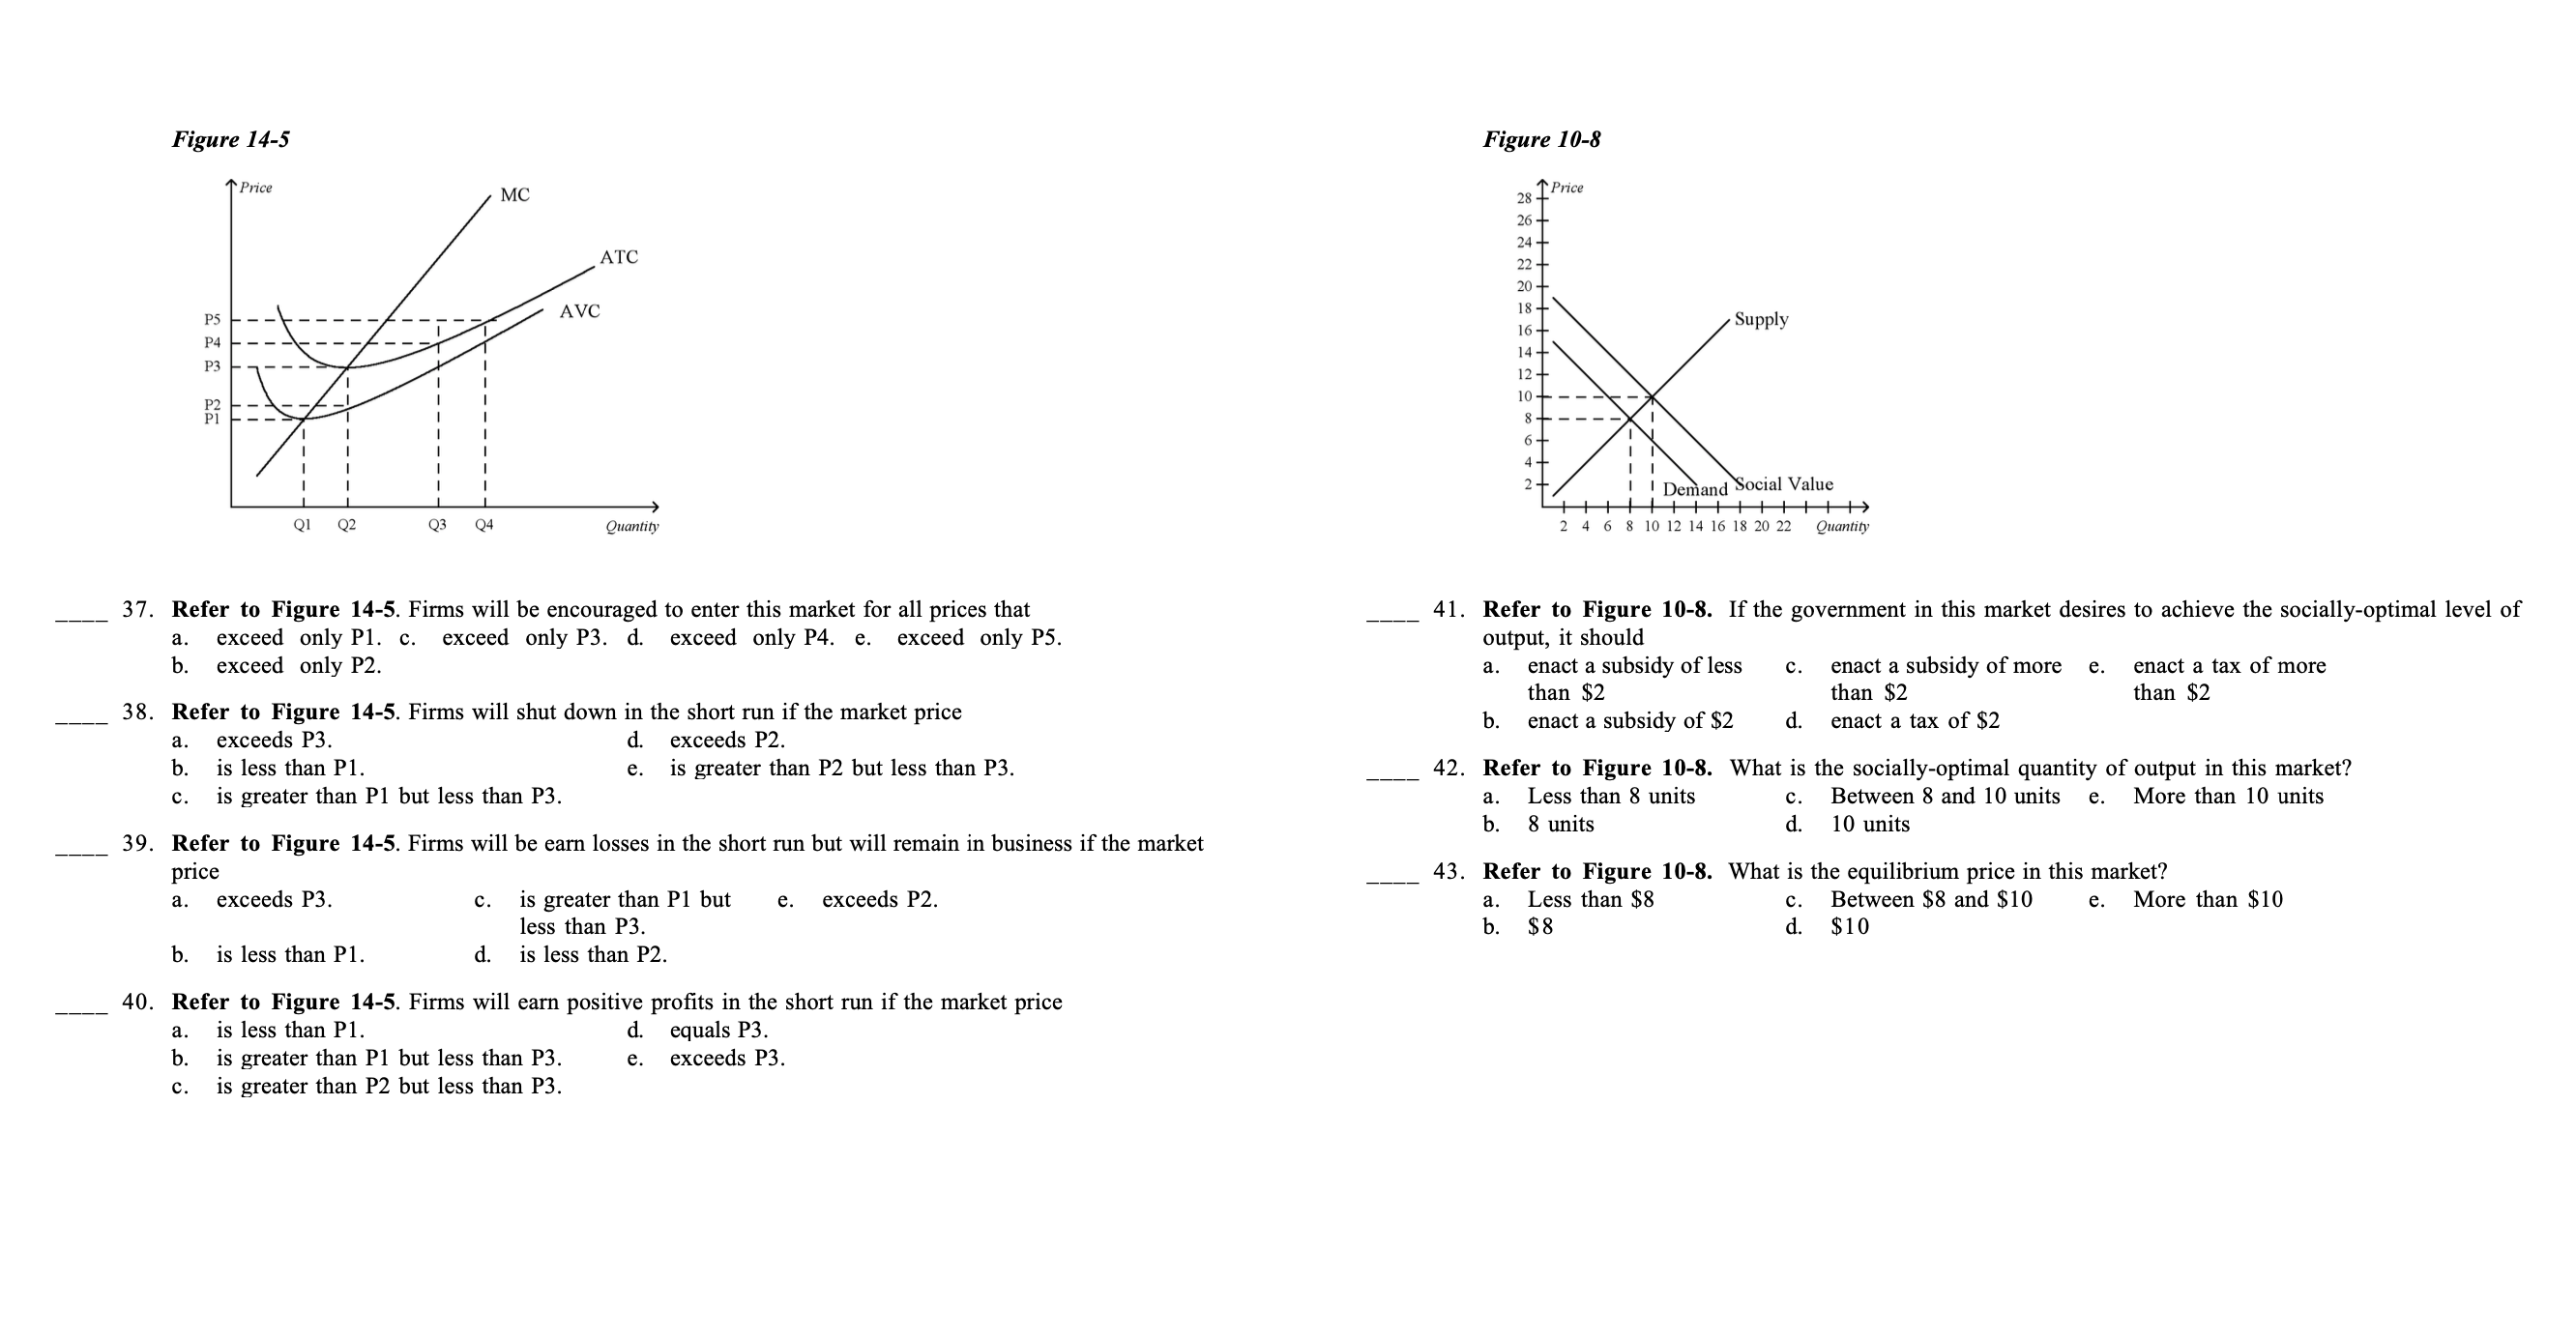
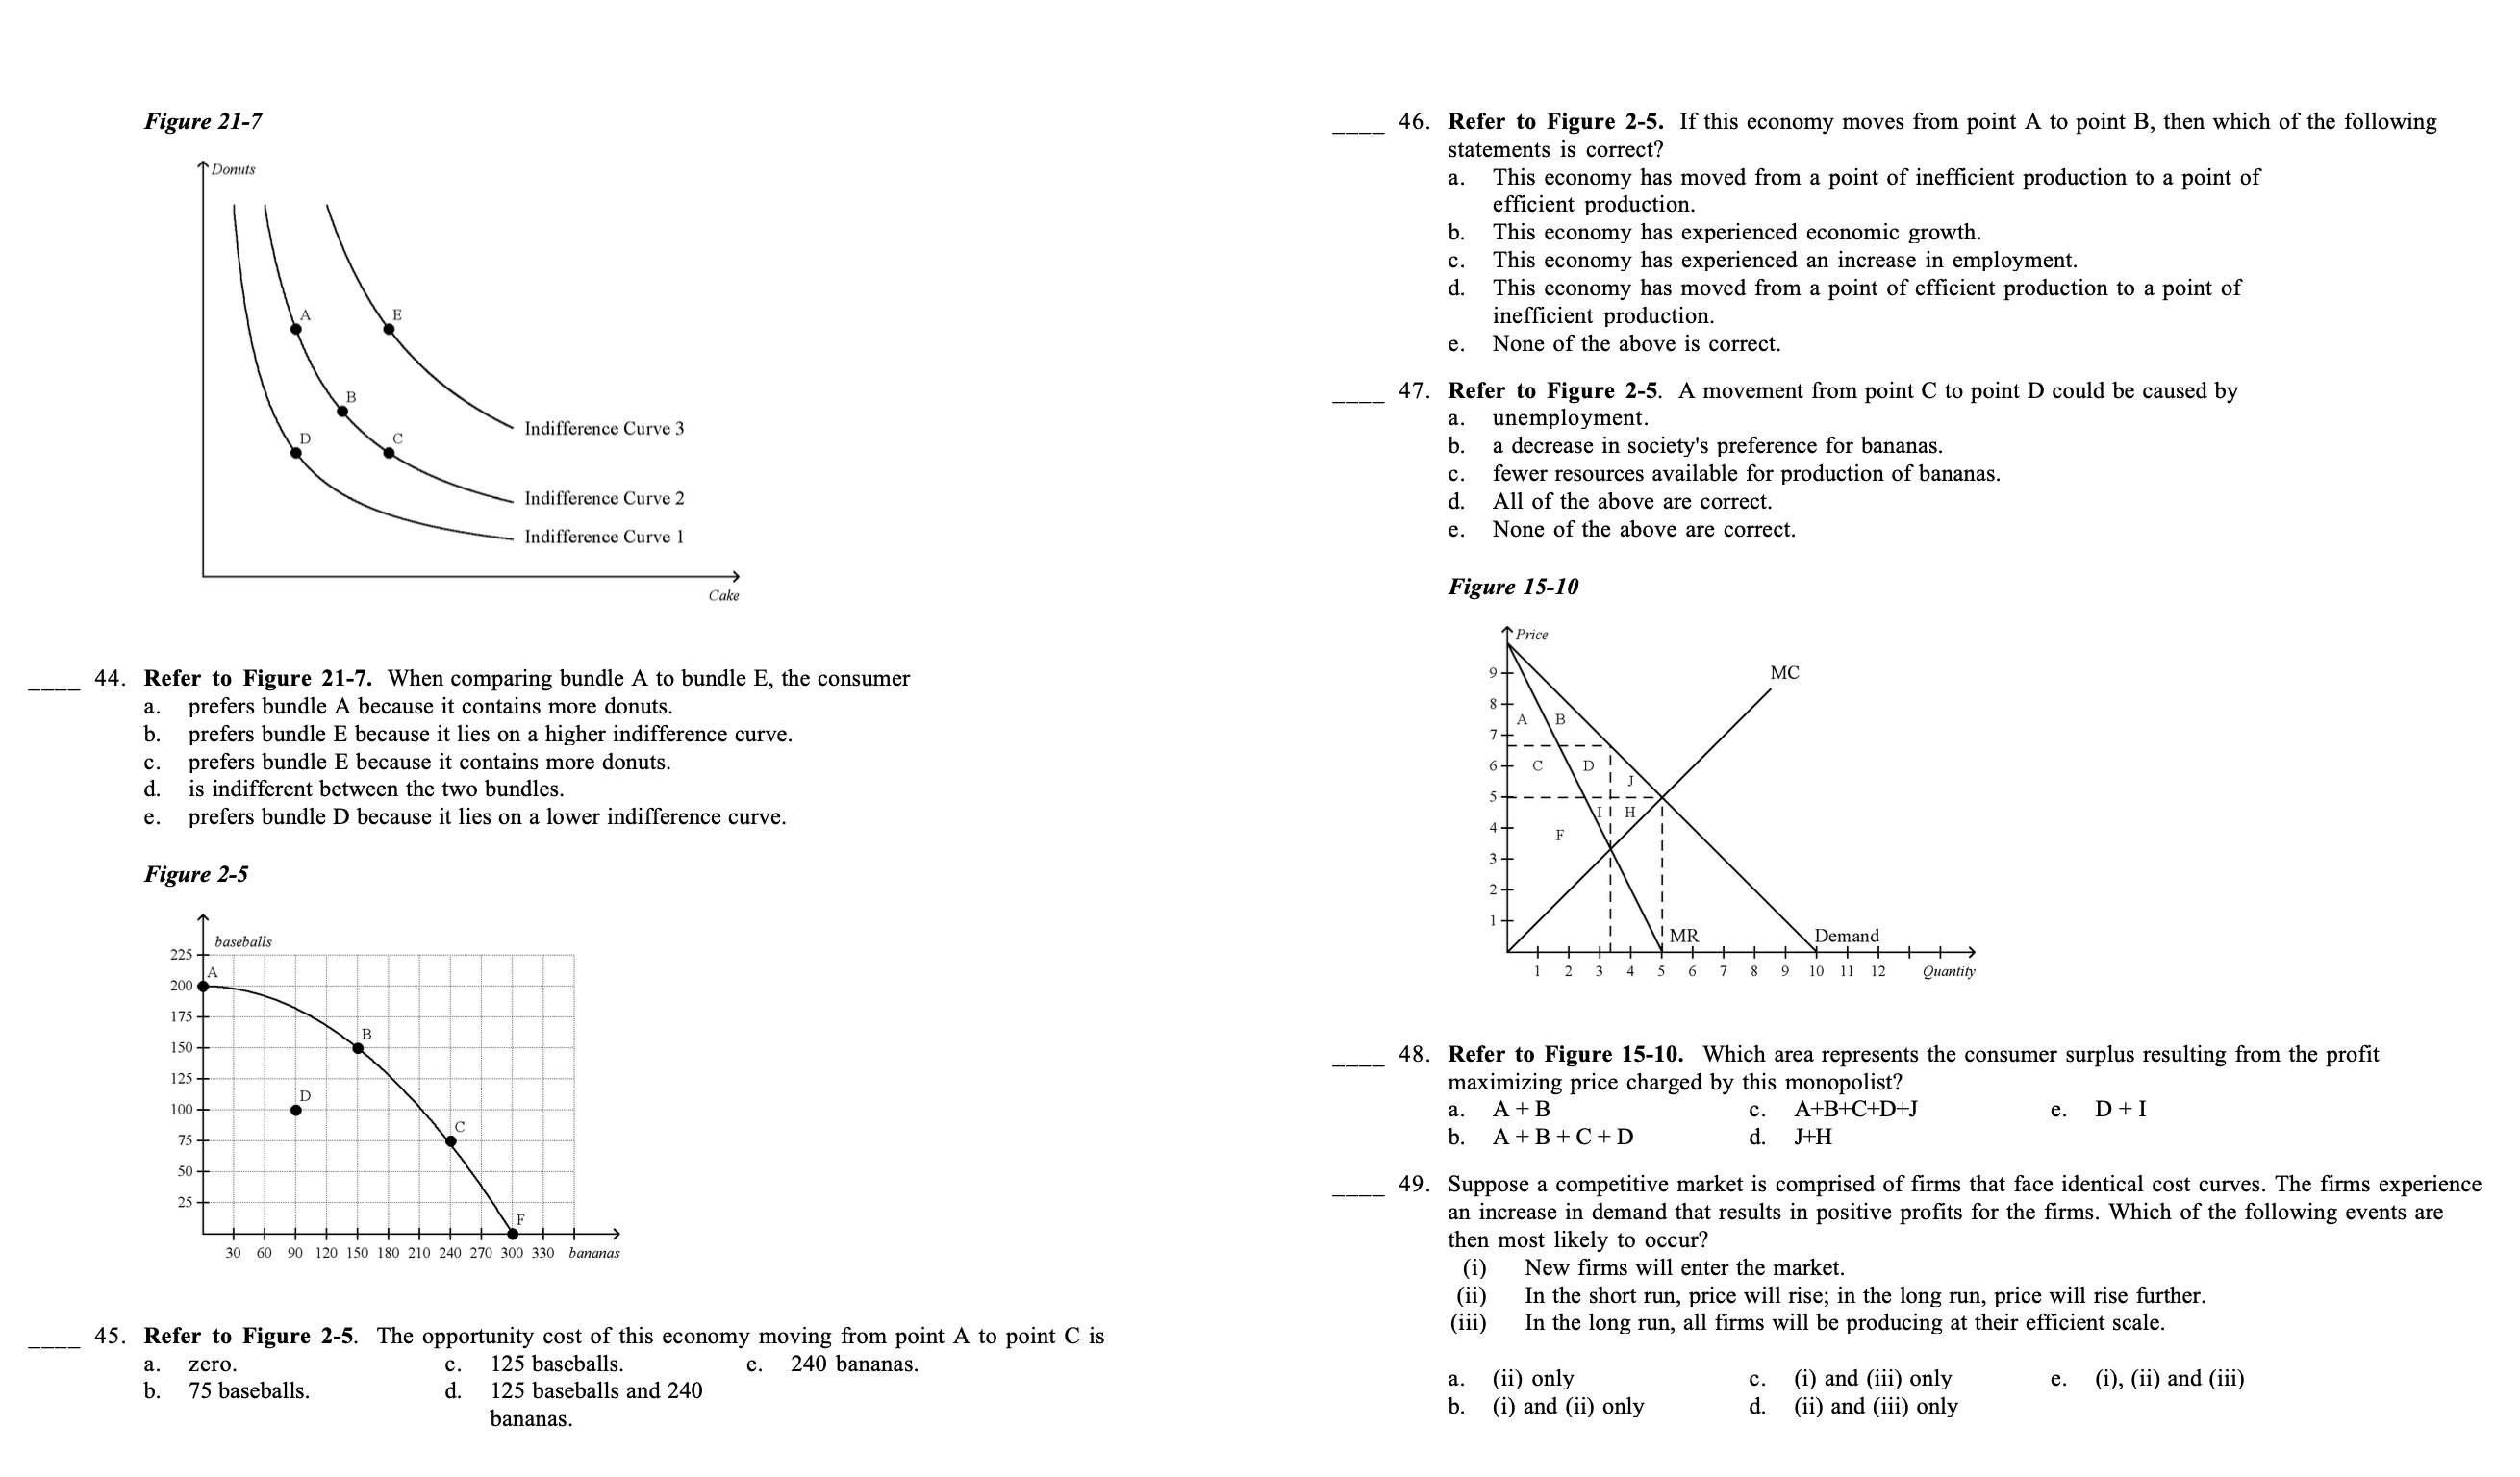
Idehtzx the choice that best completes the statement or answers the question. Figure 15-11 50 100 150 200 250 300 350 400 450 500 550 600 Quantity 1. Refer to Figure 15-11. If the monopoly rm perfectly price discriminates, then consumer surplus amounts to a. $0. 13. $250. 0. $500. d. $1,000. 6. $2,000. 2. Refer to Figure 15-11. If the monopoly rm is not allowed to price discriminate, then consumer surplus amounts to a. $0. 11. $500. c. $1,000. d. $2,000. 6. $6,000. __ 3. Refer to Figure 15-11. If the monopoly rm perfectly price discriminates, then the deadweight loss amounts to a. $0. b. $100. 0. $200. (1. $500. e. $1,000. 4. Refer to Figure 15-11. If the monopoly rm is not allowed to price discriminate, then the deadweight loss amounts to a. $50. b. $100. 0. $500. d. $1,000. 6. $2,000. Figure 8-1 Pm Supply 1" Pu Pm Demand Quannty . Refer to Figure 8-1. Suppose the government imposes a tax of P' - 1\"\". Total surplus aer the tax is measured by the area a, I+Y. c. I+Y+B. e, K+L. b. J+K+L+M. d. I+J+K+L+M+Y. . Refer to Figure 8-1. Suppose the government imposes a tax of P' - P'\". The area measured by M represents at consumer surplus aer or producer surplus aer e. total surplus alter the the tax. the tax. tax. b. consumer surplus before d. producer surplus before the tax, the tax . Refer to Figure 8-1. Suppose the government imposes a tax of P' - P'\"r Total surplus before the tax is measured by the area a, I+Yr C. L+M+Y, e, B+Nr hr J+K+L+Mr dr I+J+K+L+M+Yr . Refer to Figure 8-1. Suppose the government imposes a tax of P' - P'\"r The area measured by J represents at consumer surplus aer or producer surplus aer e. deadweight loss the tax. the tax. b. consumer surplus before d. producer surplus before the tax, the tax . Refer to Figure 8-1. Suppose the government imposes a tax of P' - P\"'r The deadweight loss due to the tax is measured by the area a. J+K+L+M. c. HY. e. B+N. hr J+K+L+M+Nr dr I+Y+Br 10. 11. 12. 13. 14. 15. Refer to Figure 8-1. Suppose the government imposes a tax of l\" - P'\". The area measured by I+J+K+L+M+Y represents a. total surplus before the 0. consumer surplus before e. producer surplus aer tax the tax the tax b. total surplus aer the d. deadweight loss -om the tax. tax. Refer to Figure 8-]. Suppose the government imposes a tax of l" - P'\". The area measured by L+M+Y represents a. consumer surplus aer c. producer surplus aer e. total surplus after the the tax. the tax. tax. bl consumer surplus before dr producer surplus before the tax. the tax. Refer to Figure 8-1. Suppose the government imposes a tax of P' - 1"\". The area measured by I+Y represents the at deadweight loss due to or loss in producer surplus e. total surplus alter the the tax. due to the tax. taxr b. loss in consumer surplus d. total surplus before the due to the tax. tax. Refer to Figure 8-1. Suppose the government imposes a tax of P' - 1"\". The area measured by J+K+L+M represents a total surplus aer the ct deadweight loss rm the e. consumer surplus before tax. tax. the tax. 1). total surplus before the (1 tax revenue. tax. Refer to Figure 8-1. Suppose the government imposes a tax of P' - P'". The area measured by J+K+I represents a. consluner surplus alter or producer surplus aer e. deadweight loss the tax. the tax. b. consumer surplus before d. producer surplus before the tax, the tax Refer to Figure 8-1. Suppose the government imposes a tax of P' - P\"'r The area measured by K+L represents a. tax revenue. 1:. producer surplus aer e. deadweightloss. the tax b. consumer surplus before d. total surplus before the the tax, tax. Scenario 13-5 21. Refer to Figure 10-4. This market is characterized by Samantha has been working for a law firm and earning an annual salary of $80,000. She decides to open a. government c. a negative externality. e. None of the above is her own practice. Her annual expenses will include $15,000 for office rent, $3,000 for equipment rental, intervention correct. $1,000 for supplies, $1,200 for utilities, and a $35,000 salary for a secretary/bookkeeper. Samantha will b. a positive externality. d. market efficiency. cover her start-up expenses by cashing in a $20,000 certificate of deposit on which she was earning annual interest of $500. 22. Refer to Figure 10-4. At 93 a. the marginal consumer values this product less than the social cost of producing it. 16. Refer to Scenario 13-5. According to an economist, which of the following revenue totals will yield b. every consumer values this product less than the social cost of producing it. her business $50,000 in economic profits C. the cost to society is equal to the value to society. a. $55,200. $130,000. e. $185,700. d. the marginal consumer values this product more than the private cost. b $100,200. $132,500. e. the marginal consumer values this product at the social cost of producing it. 17. Refer to Scenario 13-5. Samantha's annual economic costs will equal 23. Refer to Figure 10-4. If this market is currently producing at Q4, then total economic well-being would a. $55,200. C. $80,000 $135,700. be maximized if output b. $75,200 d. $80,500. a. decreased to 91. c. decreased to 23. e. increased beyond Q4. b. decreased to O2 d. stayed at Q4. 18. Refer to Scenario 13-5. Samantha's annual accounting costs will equal . $55,200 $80,000 . $165,700. 24. Refer to Figure 10-4. Externalities in this market could be internalized if b. $75,200. $80,500. a. there were a tax on the product. there were a subsidy for the product. 19. Refer to Scenario 13-5. Samantha's annual implicit costs will equal $80,000 e. $165,700. C. production were stopped a. $55,200 d. the Coase theorem failed. b $75,200. $80,500. e. market forces were allowed to achieve equilibrium. Figure 10-4 25. Refer to Figure 10-4. Externalities in this market could be internalized if Price Social Cost a. there were a tax on the c. production was stopped. e. the Coase theorm failed. Supply product. (Private Cost) b. there were a subsidy for d. markets were allowed to the product. work. 26. Refer to Figure 10-4. If this market is currently producing at 92, then total economic well-being would increase if output a. increased beyond Q4. C. increased to Q3. e. decreased to less than 21. b. decreased to Q1 d. stayed at Q2. Demand Private Value) Q3 Q4 Quantity 20. Refer to Figure 10-4. This market a. has no need for government intervention. b. would benefit from a tax on the product. would benefit from a subsidy for the product. would maximize total well-being at 23 would maximize total well-being at 24. 5Figure 4-10 32. Which of the following is an example of a barrier to entry? (1) A key resource is owned by a single firm. T price 1i) The costs of production make a single producer more efficient than a large number of producers (iii) The government has given the existing monopolist the exclusive right to produce the good. a. (i) only C. (i) and (ii) only e. (i), (ii), and (iii) b. (ii) only d. (ii) and (iii) only Figure 2-1 A B Markets for A 100 200 300 400 500 600 700 800 900 quantity Good s and B Services 27. Refer to Figure 4-10. If the price is $25, then there would be an a. excess supply of 100 and price would fall. Firms Households b. excess supply of 300 and price would fall. C. excess demand of 100 and price would fall. d. excess demand of 300 and price would fall. e. excess supply of 300 and price would rise. Markets for D Factcers of 28. Refer to Figure 4-10. At a price of $15, D Production a. quantity demanded exceeds quantity supplied. b. there is a shortage. 33. Refer to Figure 2-1. Which arrow represents the flow of land, labor, and capital? C. there is an excess demand d. a. A b. B market forces will act to increase the price. c. C d. D e. A and D e. All of the above are correct 34. Refer to Figure 2-1. Which arrow represents the flow of goods and services? a. A b. B C. C d. D 29. Refer to Figure 4-10. If the price is $10, then there would be a A and D a. shortage of 400 and price would rise. 35. Refer to Figure 2-1. Which arrow represents the flow of spending by households? b. surplus of 400 and price would rise. a. A b. c. C d. D e. A and D C. shortage of 600 and price would rise. d. surplus of 600 and price would rise. 36. Refer to Figure 2-1. Which arrow represents the flow of income payments? e. shortage of 600 and price would fall. a. A b. B c. C d. D e. B and C 30. Refer to Figure 4-10. In this market, equilibrium price and quantity, respectively, are $15 and 400. c. $20 and 600 e. $25 and 800. b. $15 and 700. d. $25 and 500. 31. The Massachusetts Turnpike is a tolled freeway running through the state of Massachusetts. Motorists must pay tolls at various points along the Turnpike based on the distance they traveled on the freeway. Suppose that despite the tolls, many motorists in the urban areas use the Turnpike causing traffic to slow during peak times. What type of good would the Turnpike be classified as in this case? a. Private good c. Common resource e. Common good Natural monopoly d. Public good37. 38. 39. 40. Figure 14-5 Q] (72 (23 as Quantity Refer to Figure 14-5. Firms will be encouraged to enter this market for all prices that a. exceed only Pl. c. exceed only P3. d. exceed only P4. e. exceed only PS. b, exceed only P2, Refer to Figure Inf-Si Firms will shut down in the short run if the market price a, exceeds P3. d exceeds P2. b is less than Pll e is greater than P2 but less than P} c. is greater than P1 but less than P3. Refer to Figure 14-5. Firms will be earn losses in the short run but will remain in business if the market price a, exceeds P3. e. is greater than P1 but e. exceeds P2, less than P} b, is less than Pl. (L is less than P2, Refer to Figure 14-5. Firms will earn positive prots in the short run if the market price a. is less than 1'1. d. equals P3. b, is greatei than P1 but less than P3. e. exceeds P3. e is greater than P2 but less than P1 41, 42, 43. Figure 10-8 2 4 s s m n M is l8 in 22 gmugr Refer to Figure 10-8. If the government in this market desires to achieve the socially-optimal level of output, it should a. enact a subsidy of less c, than 82 b. enact a subsidy of 32 d, enact a tax of more than $2 enact a subsidy of more e. than $2 enact a tax of $2 Refer to Figure 10-8. What is the socially-optimal quantity of output in this market? a. Less than 8 units c, Between 8 and 10 units c. More than 10 units hi 8 units d. 10 units Refer to Figure 10-8. What is the equilibrium price in this market? a. Less than 58 0, Between $8 and $10 e. More than 310 b $8 dl $10 Figure 21-7 46. Refer to Figure 2-5. If this economy moves from point A to point B, then which of the following statements is correct? T Donuts a. This economy has moved from a point of inefficient production to a point of efficient production. b. This economy has experienced economic growth. C. This economy has experienced an increase in employment. d. This economy has moved from a point of efficient production to a point of Inefficient production e. None of the above is correct. 47. Refer to Figure 2-5. A movement from point C to point D could be caused by Indifference Curve 3 a. unemployment. b. a decrease in society's preference for bananas. C. fewer resources available for production of bananas. Indifference Curve 2 d. All of the above are correct Indifference Curve 1 e. None of the above are correct. Cake Figure 15-10 Price 44. Refer to Figure 21-7. When comparing bundle A to bundle E, the consumer MC a. prefers bundle A because it contains more donuts. prefers bundle E because it lies on a higher indifference curve. B C. prefers bundle E because it contains more donuts. C is indifferent between the two bundles. e. prefers bundle D because it lies on a lower indifference curve. Figure 2-5 baseballs Demand 200 10 11 12 -+ Quantity 175 150 - 48. Refer to Figure 15-10. Which area represents the consumer surplus resulting from the profit 125 maximizing price charged by this monopolist? 100 - a. A+ B C. A+B+C+D+J e. D+I 75. b. A + B + C+D J+H 50 - 25. 49. Suppose a competitive market is comprised of firms that face identical cost curves. The firms experience an increase in demand that results in positive profits for the firms. Which of the following events are 30 60 90 120 150 180 210 240 270 300 330 bananas then most likely to occur? (1) New firms will enter the market. (ii) In the short run, price will rise; in the long run, price will rise further. 45. Refer to Figure 2-5. The opportunity cost of this economy moving from point A to point C is (iii) In the long run, all firms will be producing at their efficient scale. a. zero. 125 baseballs. e. 240 bananas b. 75 baseballs. d. 125 baseballs and 240 a. (ii) only c. (1) and (iii) only e. (i), (ii) and (iii) b. (i) and (ii) only d. bananas. (ii) and (iii) only
Step by Step Solution
There are 3 Steps involved in it

Get step-by-step solutions from verified subject matter experts