

Question: identify and explain where the deconsolidated information came from, why you chose what you chose to deconsolidate, how it looks afterward, and then have a
identify and explain where the deconsolidated information came from, why you chose what you chose to deconsolidate, how it looks afterward, and then have a discussion about its importance.
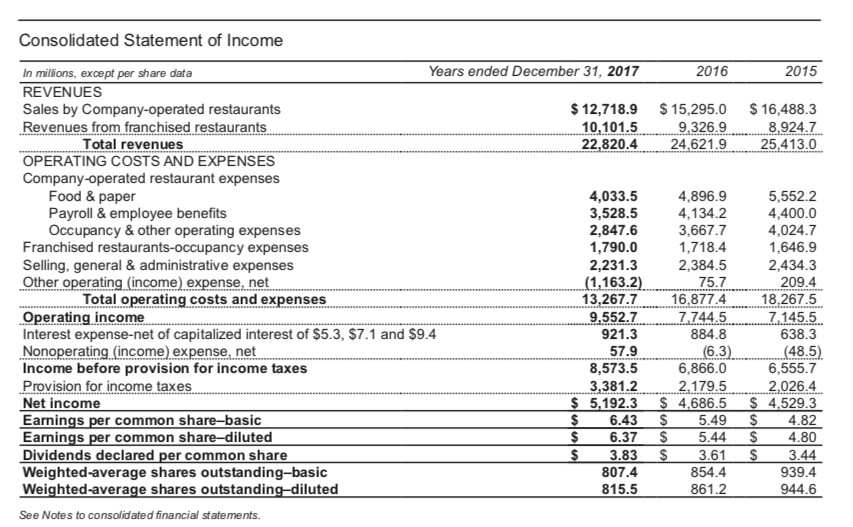
2015 $ 16,488.3 8,924.7 25,413.0 Consolidated Statement of Income In millions, except per share data Years ended December 31, 2017 2016 REVENUES Sales by Company-operated restaurants $ 12,718.9 $ 15,295.0 Revenues from franchised restaurants 10,101.5 9,326.9 Total revenues 22,820.4 24,621.9 OPERATING COSTS AND EXPENSES Company-operated restaurant expenses Food & paper 4,033.5 4,896.9 Payroll & employee benefits 3,528.5 4,134.2 Occupancy & other operating expenses 2,847.6 3,667.7 Franchised restaurants-occupancy expenses 1,790.0 1,718.4 Selling, general & administrative expenses 2,231.3 2,384.5 Other operating (income) expense, net (1,163.2). 75.7 Total operating costs and expenses 13,267.7 16,877.4 Operating income 9,552.7 7,744.5 Interest expense-net of capitalized interest of $5.3, $7.1 and $9.4 921.3 884.8 Nonoperating (income) expense, net 57.9 (6.3). Income before provision for income taxes 8,573.5 6,866.0 Provision for income taxes 3,381.2 2,179.5 Net income $ 5,192.3 $ 4,686.5 Earnings per common share-basic $ 6.43 $ 5.49 Earnings per common share-diluted $ 6.37 $ 5.4 Dividends declared per common share $ 3.83 3.61 Weighted average shares outstanding-basic 807.4 854.4 Weighted average shares outstanding-diluted 815.5 861.2 See Notes to consolidated financial statements. 5,552.2 4,400.0 4,024.7 1,646.9 2,434.3 209.4 18,267.5 7.145.5 638.3 (48.5) 6,555.7 2,026.4 $ 4,529.3 $ 4.82 4.80 $ 3.44 939.4 944.6 $ 2015 $ 16,488.3 8,924.7 25,413.0 Consolidated Statement of Income In millions, except per share data Years ended December 31, 2017 2016 REVENUES Sales by Company-operated restaurants $ 12,718.9 $ 15,295.0 Revenues from franchised restaurants 10,101.5 9,326.9 Total revenues 22,820.4 24,621.9 OPERATING COSTS AND EXPENSES Company-operated restaurant expenses Food & paper 4,033.5 4,896.9 Payroll & employee benefits 3,528.5 4,134.2 Occupancy & other operating expenses 2,847.6 3,667.7 Franchised restaurants-occupancy expenses 1,790.0 1,718.4 Selling, general & administrative expenses 2,231.3 2,384.5 Other operating (income) expense, net (1,163.2). 75.7 Total operating costs and expenses 13,267.7 16,877.4 Operating income 9,552.7 7,744.5 Interest expense-net of capitalized interest of $5.3, $7.1 and $9.4 921.3 884.8 Nonoperating (income) expense, net 57.9 (6.3). Income before provision for income taxes 8,573.5 6,866.0 Provision for income taxes 3,381.2 2,179.5 Net income $ 5,192.3 $ 4,686.5 Earnings per common share-basic $ 6.43 $ 5.49 Earnings per common share-diluted $ 6.37 $ 5.4 Dividends declared per common share $ 3.83 3.61 Weighted average shares outstanding-basic 807.4 854.4 Weighted average shares outstanding-diluted 815.5 861.2 See Notes to consolidated financial statements. 5,552.2 4,400.0 4,024.7 1,646.9 2,434.3 209.4 18,267.5 7.145.5 638.3 (48.5) 6,555.7 2,026.4 $ 4,529.3 $ 4.82 4.80 $ 3.44 939.4 944.6 $
Step by Step Solution
There are 3 Steps involved in it

Get step-by-step solutions from verified subject matter experts