

Question: Identify and remove relevant points: Identify one point on each scatter plot that has the greatest impact on the model by using residual plots. Describe
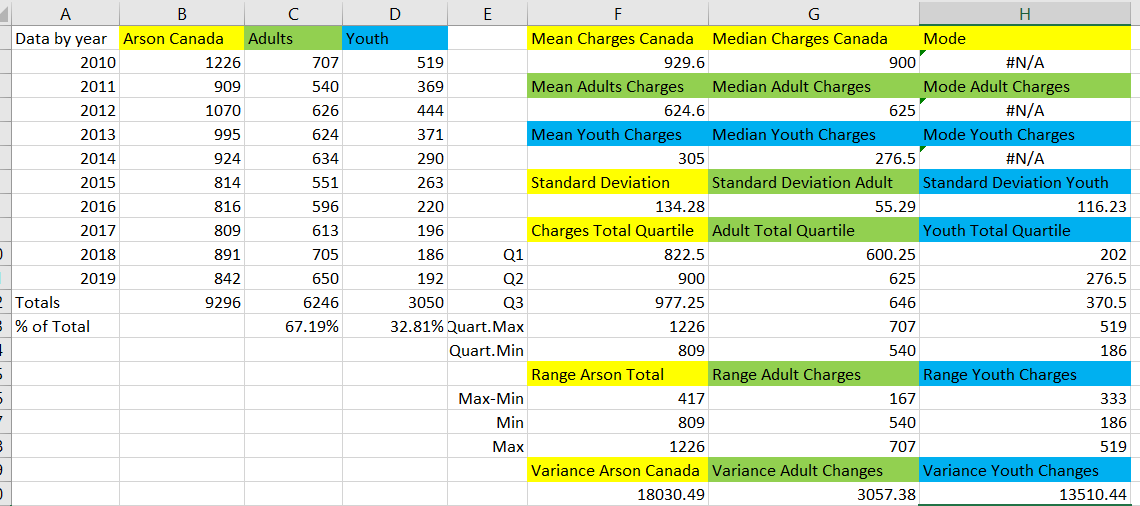
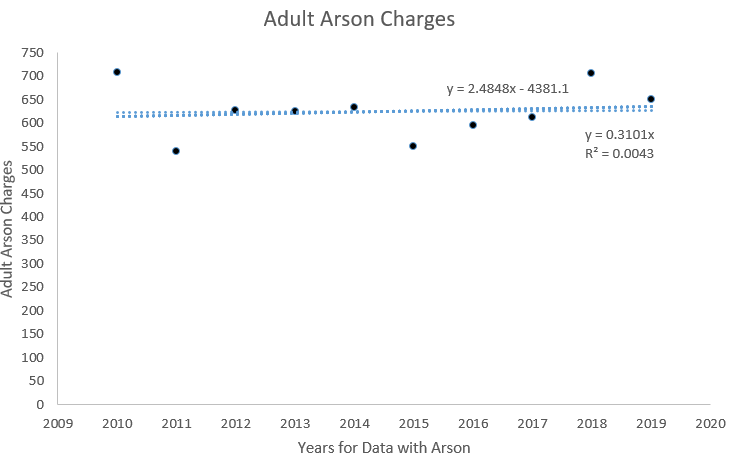
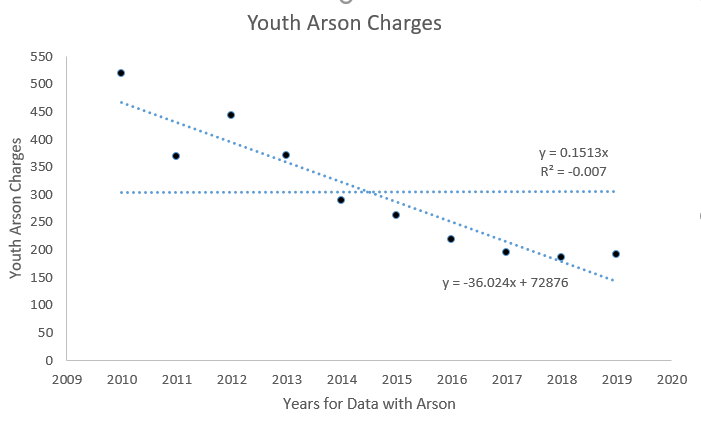
Identify and remove relevant points: Identify one point on each scatter plot that has the greatest impact on the model by using residual plots. Describe the percentile that the point would be if the data was normally distributed, by using the mean, standard deviation and z-score. Describe the impact of the point by comparing the new linear model to the original. Please show all work from the information provided.
Step by Step Solution
There are 3 Steps involved in it
1 Expert Approved Answer
Step: 1 Unlock

Question Has Been Solved by an Expert!
Get step-by-step solutions from verified subject matter experts
Step: 2 Unlock
Step: 3 Unlock