

Question: Identify and remove relevant points: Identify one point on each scatter plot that has the greatest impact on the model by using residual plots. Describe
Identify and remove relevant points:Identify one point on each scatter plot that has the greatest impact on the model by using residual plots. Describe the impact of the point by comparing the new linear model to the original.
Here is the data I used for the scatter plots:
| Year | 2002 | 2003 | 2004 | 2005 | 2006 | 2007 | 2008 | 2009 | 2010 | 2011 | 2012 | 2013 | 2014 | 2015 | 2016 | 2017 |
| GDP (current US$) | 1.91E+12 | 1.81E+12 | 1.85E+12 | 1.83E+12 | 1.79E+12 | 1.62E+12 | 1.37E+12 | 1.55E+12 | 1.47E+12 | 1.32E+12 | 1.17E+12 | 1.03E+12 | 8.96E+11 | 7.61E+11 | 7.39E+11 | 7.27E+11 |
| Adjusted Net National Income per capita (current US$) | 35337.8 | 41604.75 | 43034.9 | 42991.14 | 42587.83 | 38702.43 | 33001.14 | 37863.16 | 36608.77 | 33140.43 | 29581.93 | 26105.64 | 22964.15 | 19043.6 | 19538.27 | 19428.6 |
| Individuals using the internet (% of the population) | 90 | 87.12 | 85.8 | 83 | 83 | 80.3 | 80.3 | 76.7 | 73.2 | 72.4 | 71.66 | 65.9 | 62.2 | 61.5 | 60.2 | 51.3 |
The scatter plots are attached.
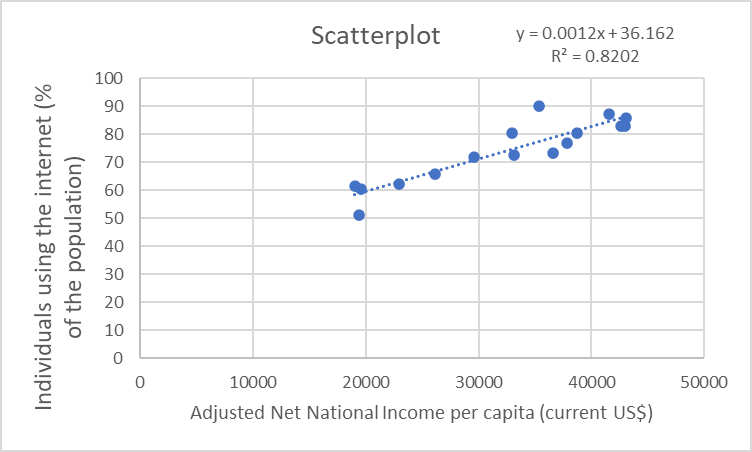
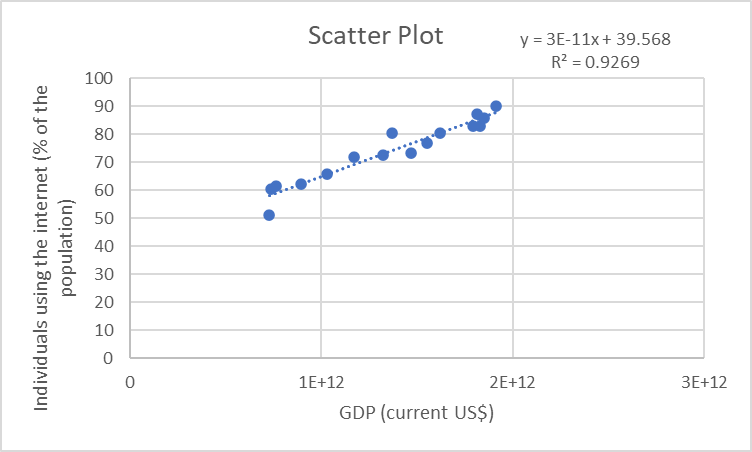
Scatterplot y = 0.0012x+36.162 R2 = 0.8202 100 90 80 70 Individuals using the internet (% of the population) 10 O 0 10000 20000 30000 40000 50000 Adjusted Net National Income per capita (current US$)Scatter Plot y = 3E-11x + 39.568 R2 = 0.9269 100 90 80 70 60 50 population) Individuals using the internet (% of the 40 20 10 O O 1E+12 2E+12 3E+12 GDP (current US$)
Step by Step Solution
There are 3 Steps involved in it

Get step-by-step solutions from verified subject matter experts