

Question: Identify the histogram for the frequency distribution below. Bin Frequency [2, 7) [7, 12) 5 [12. 17) 6 [17, 22) 6 [22, 27) 2 Frequency
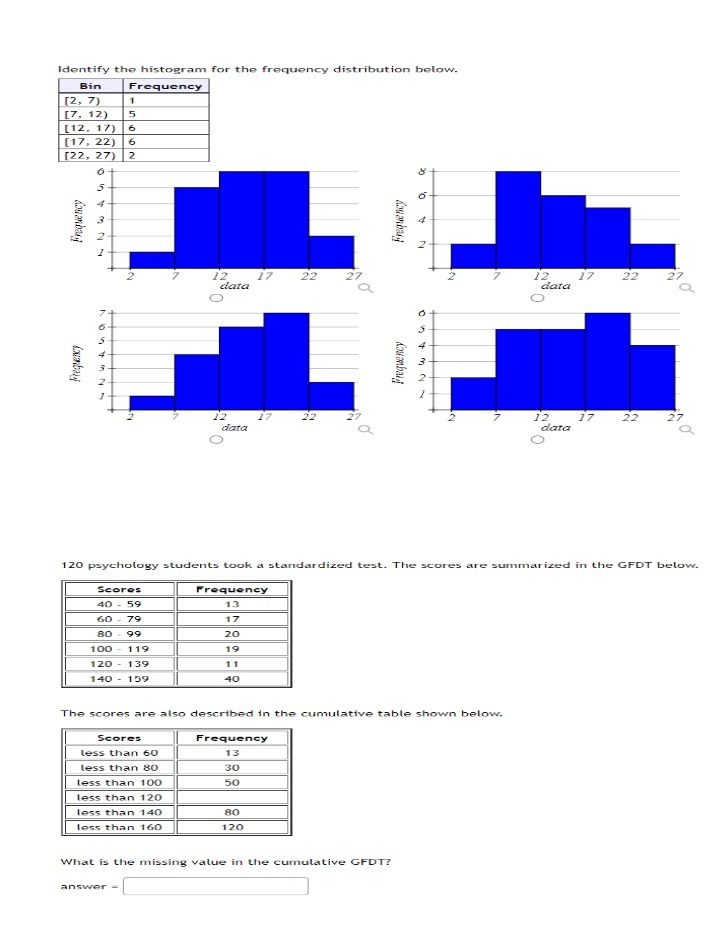
Identify the histogram for the frequency distribution below. Bin Frequency [2, 7) [7, 12) 5 [12. 17) 6 [17, 22) 6 [22, 27) 2 Frequency Frequency A N 2 7 data 17 22 2 2 2 data 17 22 O Frequency Frequency 12 data 17 22 2 7 data 17 22 27 120 psychology students took a standardized test. The scores are summarized in the GFDT below. Scores Frequency 40 - 59 13 60 . 79 17 80 - 99 20 100 - 119 19 120 - 139 11 140 - 159 40 The scores are also described in the cumulative table shown below. Scores Frequency less than 60 13 less than 80 30 less than 100 50 less than 120 less than 140 80 less than 160 120 What is the missing value in the cumulative GFDT? answer =
Step by Step Solution
There are 3 Steps involved in it

Get step-by-step solutions from verified subject matter experts