

Question: please explain step by step on Excel!!: 1. how do i enter the data into one column? 2. Enter the class limits and Upper limits!
1. how do i enter the data into one column?
2. Enter the class limits and Upper limits!
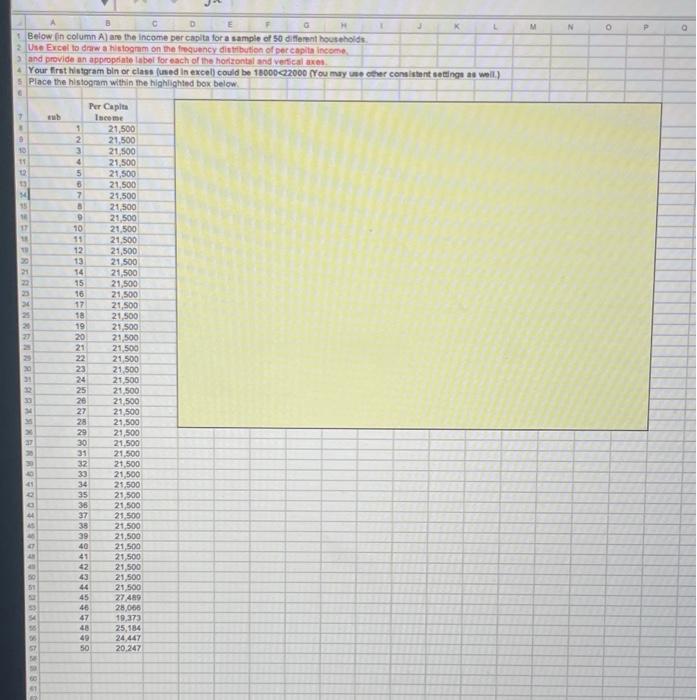
C D E G H 1 Below (in column A) are the income per capita for a sample of 50 different households. 2 Use Excel to draw a histogram on the frequency distribution of per capita income, 0 11 12 13 3 and provide an appropriate label for each of the horizontal and vertical axes. 4 Your first histgram bin or class (used in excel) could be 18000
Step by Step Solution
There are 3 Steps involved in it
1 Expert Approved Answer
Step: 1 Unlock

Solution The his toguam is 09 20 Labra 16 14 10 2 8 The Cosy Histogram 22000 per capita income 300... View full answer
Question Has Been Solved by an Expert!
Get step-by-step solutions from verified subject matter experts
Step: 2 Unlock
Step: 3 Unlock