

Question: Identify the story and encoding used in this visual. Apple R&D vs . Revenue Y / Y Growth Points, Time series display Points connected by
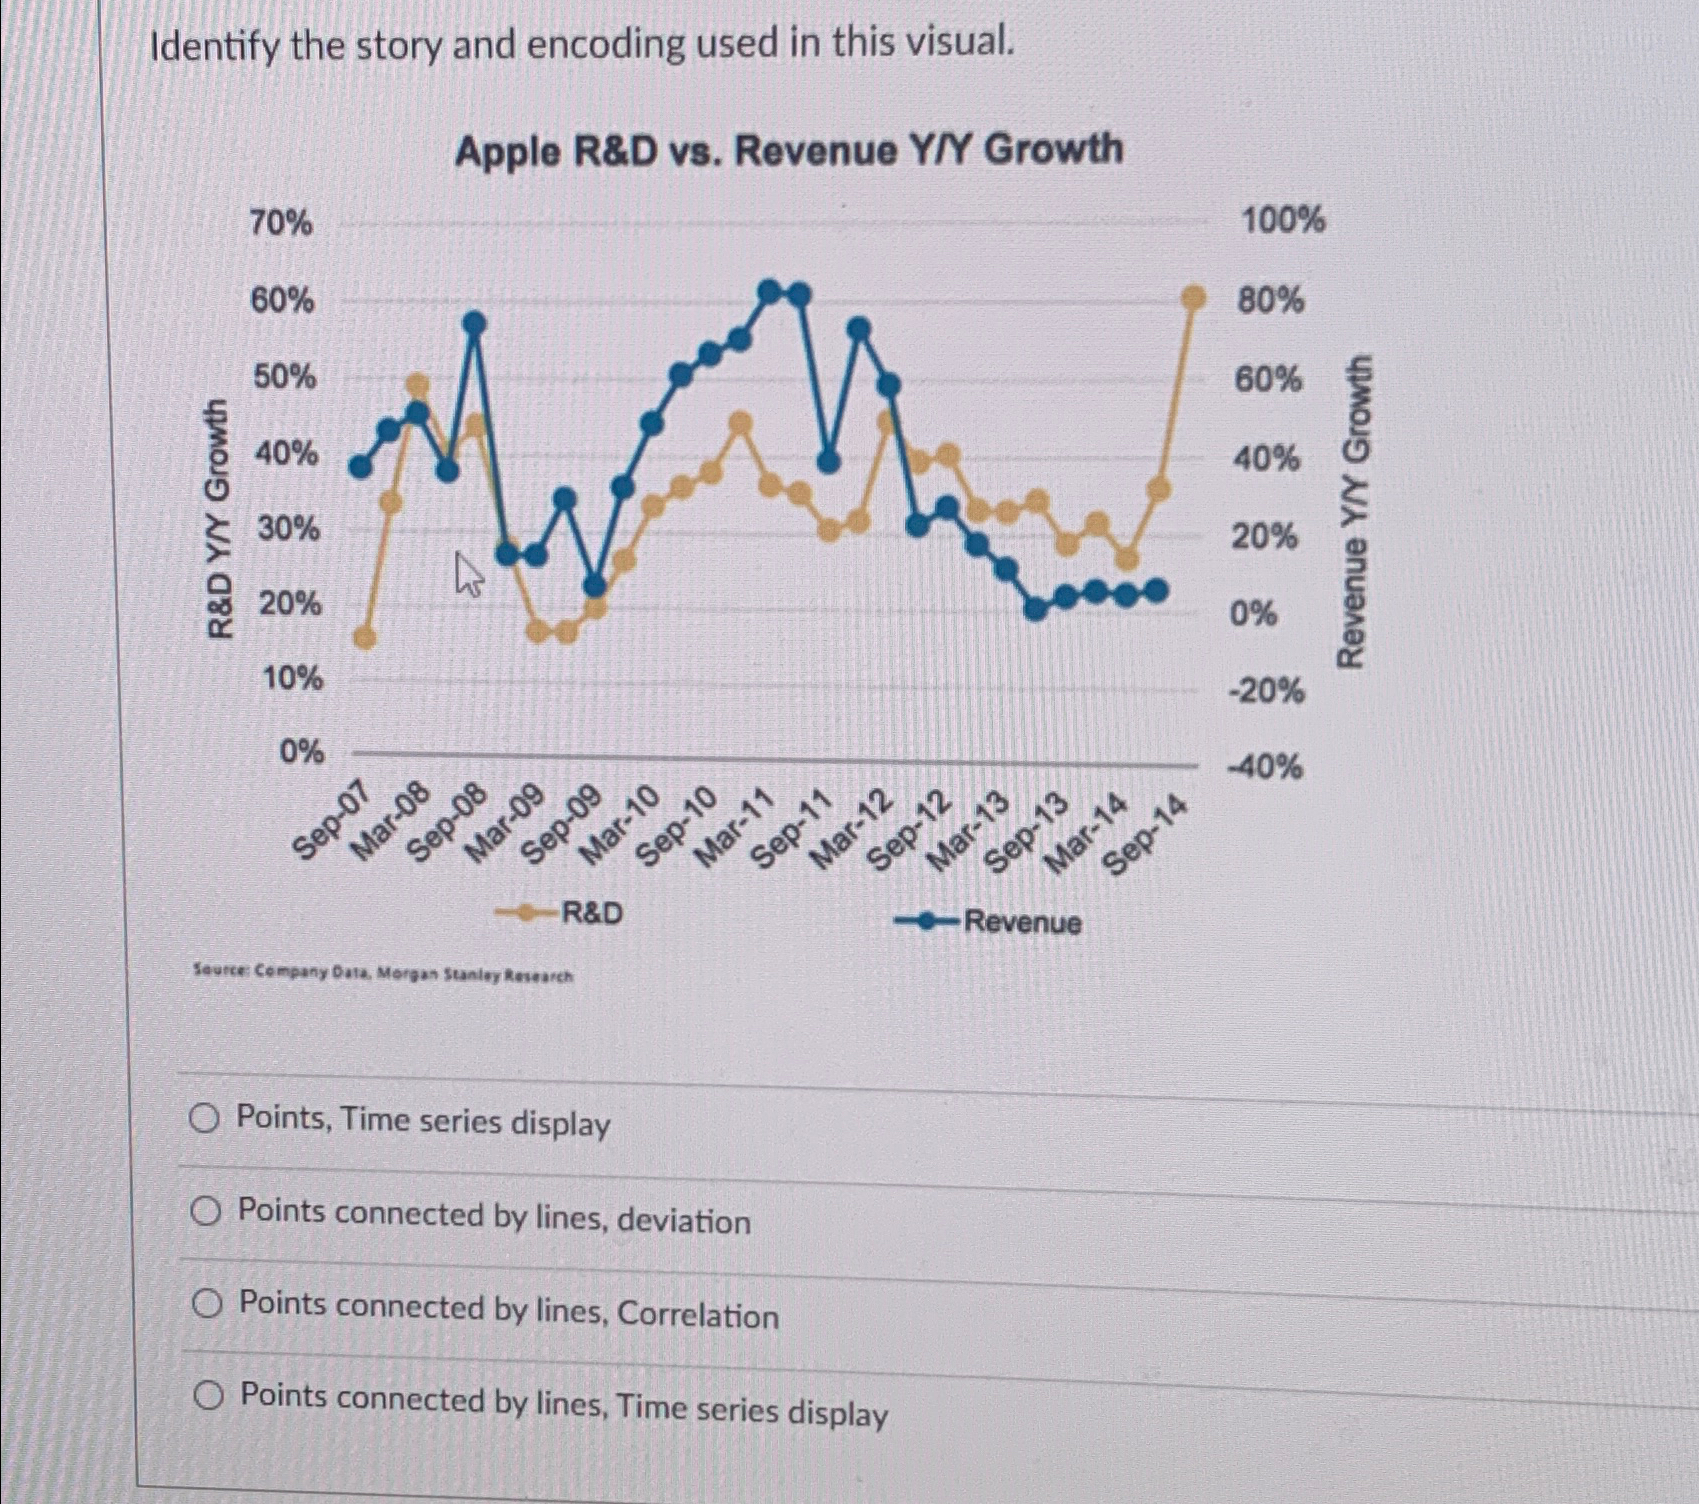
Identify the story and encoding used in this visual.
Apple R&D vs Revenue YY Growth
Points, Time series display
Points connected by lines, deviation
Points connected by lines, Correlation
Points connected by lines, Time series display
Step by Step Solution
There are 3 Steps involved in it
1 Expert Approved Answer
Step: 1 Unlock

Question Has Been Solved by an Expert!
Get step-by-step solutions from verified subject matter experts
Step: 2 Unlock
Step: 3 Unlock