

Question: Identify the upper class limits for the given frequency distribution. Age (years) when award was won Frequency 20-24 29 25-29 33 30-34 16 35-39 2


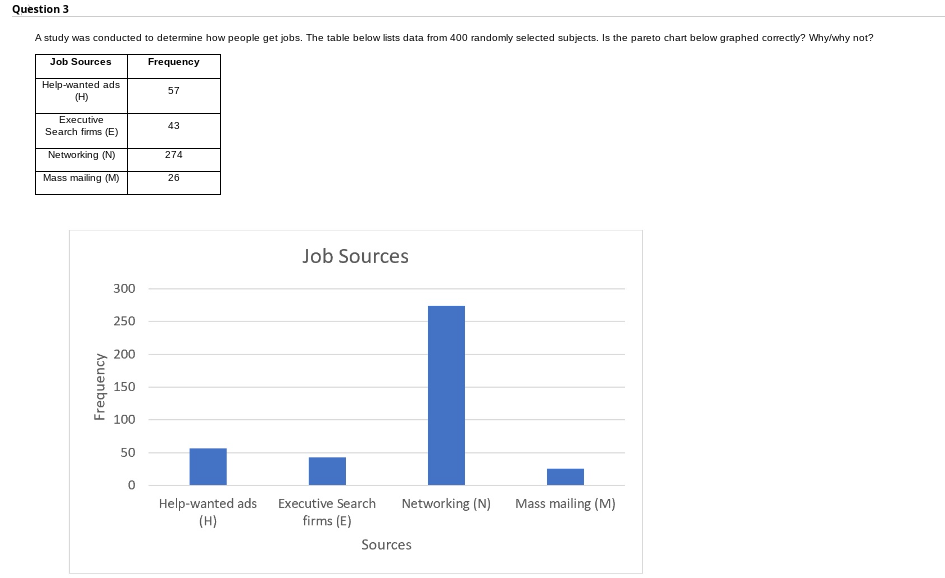
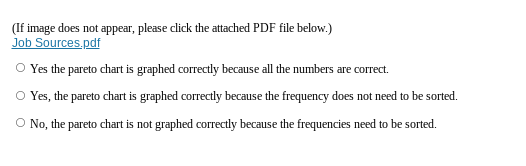

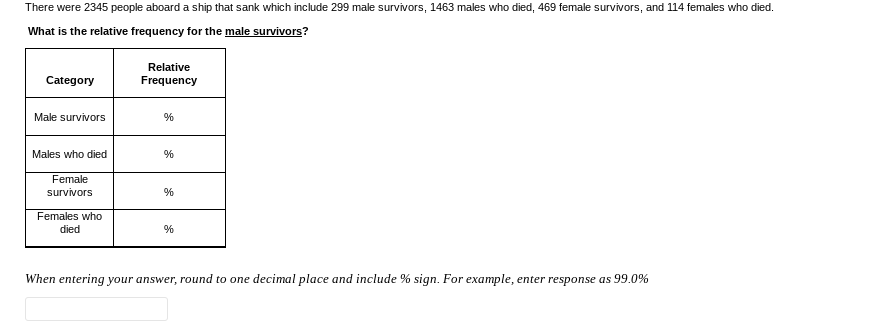
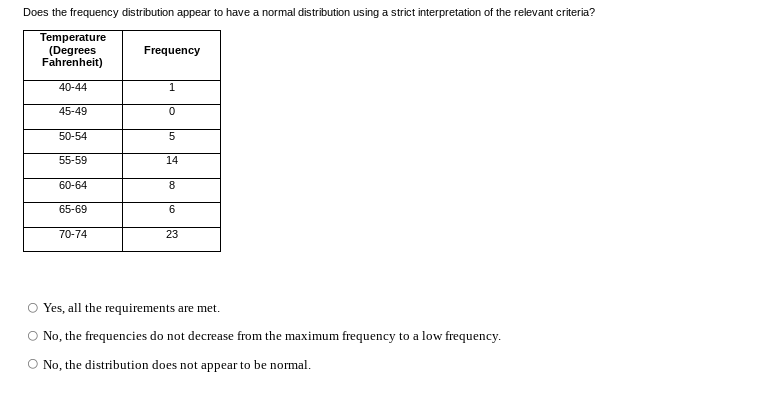
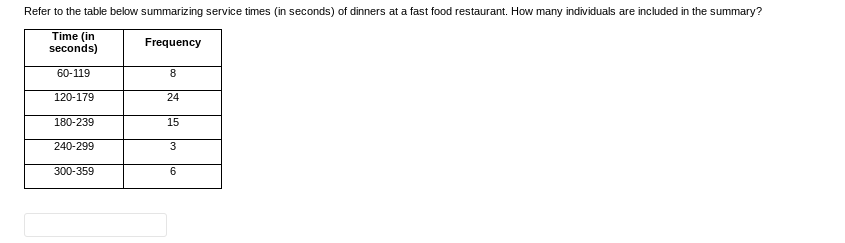

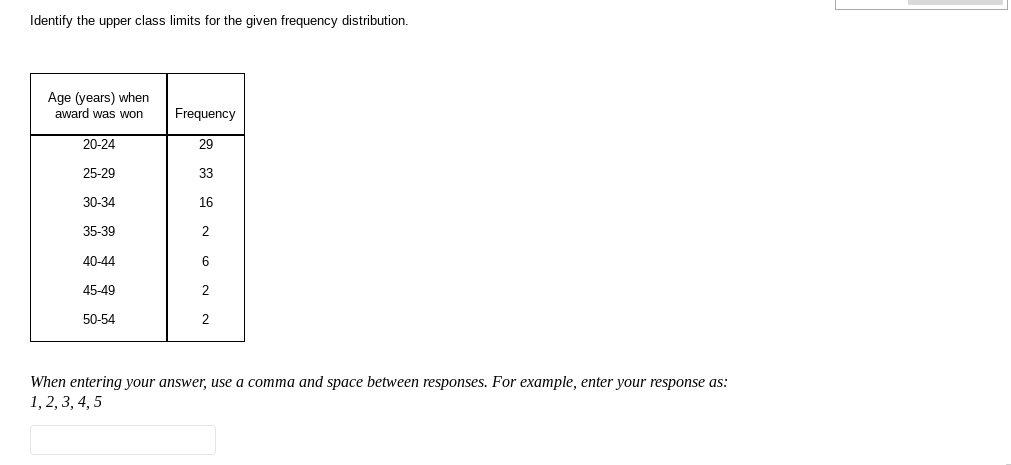
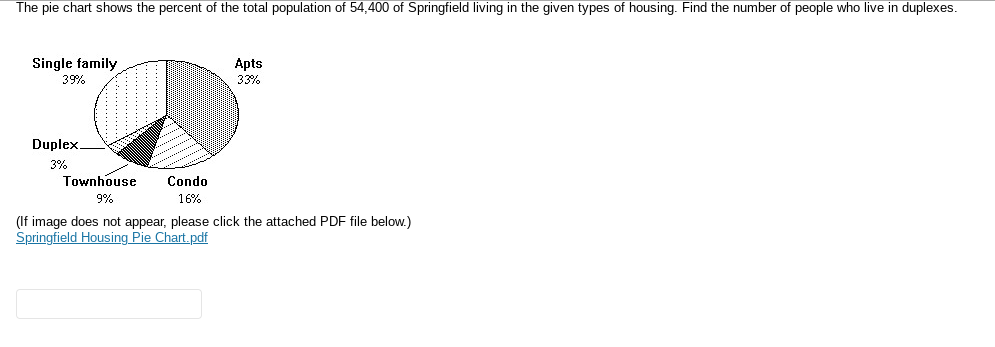


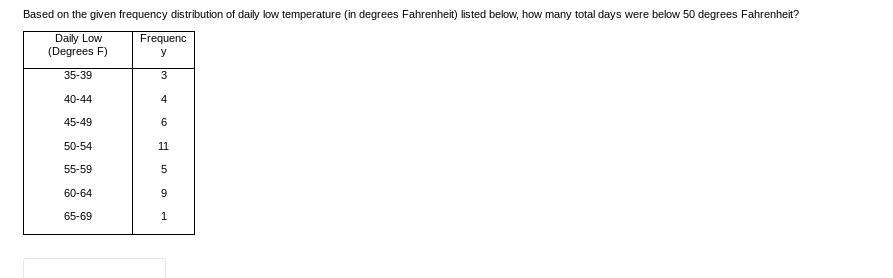


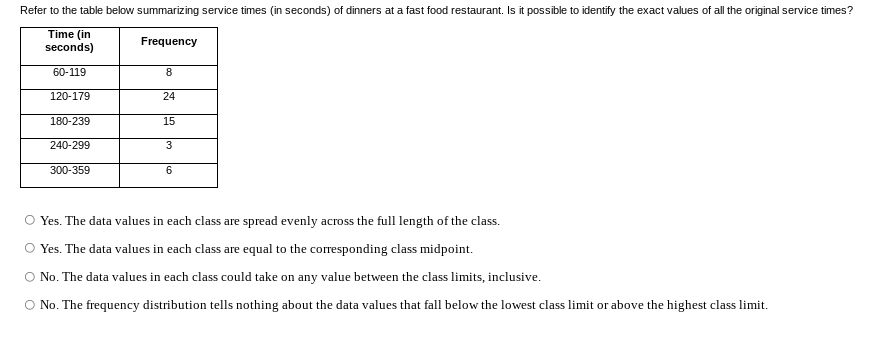
Identify the upper class limits for the given frequency distribution. Age (years) when award was won Frequency 20-24 29 25-29 33 30-34 16 35-39 2 40-44 6 45-49 50-54 When entering your answer, use a comma and space between responses. For example, enter your response as: 1, 2, 3, 4, 5The pie chart shows the percent of the total population of 54400 of Springfield living in the given types of housing. Find the number of people who live in duplexes. Single family 39% Apts 3 3% Duplex 3% // Townhouse Condo 9% 16% (If image does not appear= please click the attached PDF file below} gmgtield Housing Pie Charti Question 3 A study was conducted to determine how people get jobs. The table below lists data from 400 randomly selected subjects. Is the pareto chart below graphed correctly? Why/why not? Job Sources Frequency Help-wanted ads 57 (H) Executive 43 Search firms (8) Networking (N) 274 Mass mailing (M) 26 Job Sources 300 250 200 Frequency 150 100 50 0 Help-wanted ads Executive Search Networking (N) Mass mailing (M) (H) firms (E) Sources(If image does not appear, please click the attached PDF file below.) Job Sources.pdf Yes the pareto chart is graphed correctly because all the numbers are correct. O Yes, the pareto chart is graphed correctly because the frequency does not need to be sorted. O No, the pareto chart is not graphed correctly because the frequencies need to be sorted.Based on the given frequency distribution of daily low temperature (in degrees Fahrenheit) listed below, how many total days were below 50 degrees Fahrenheit? Daily Low Frequenc (Degrees F) y 35-39 40-44 45-49 6 50-54 11 55-59 5 60-64 9 65-69 1There were 2345 people aboard a ship that sank which include 299 male survivors, 1463 males who died, 469 female survivors, and 114 females who died. What is the relative frequency for the male survivors? Relative Category Frequency Male survivors Males who died Female survivors 9% Females who died 9% When entering your answer, round to one decimal place and include % sign. For example, enter response as 99.0%Below is a dotplot of volumes in bottles of soda cans (in ounces). How many total cans are included in the study? Volumes of soda (oz) 50 60 70 80 90 (If image does not appear, please click the attached PDF file below.) Volumes of Soda Cans Dotplot.pdfDoes the frequency distribution appear to have a normal distribution using a strict interpretation of the relevant criteria? Temperature (Degrees Frequency Fahrenheit) 40-44 1 45-49 0 50-54 5 55-59 14 60-64 8 65-69 6 70-74 23 O Yes, all the requirements are met. O No, the frequencies do not decrease from the maximum frequency to a low frequency. O No, the distribution does not appear to be normal.Refer to the table below summarizing service times (in seconds) of dinners at a fast food restaurant. How many individuals are included in the summary? Time (in seconds) Frequency 60-119 8 120-179 24 180-239 15 240-299 3 300-359 6Refer to the table below summarizing service times (in seconds) of dinners at a fast food restaurant. Is it possible to identify the exact values of all the original service times? Time (in seconds) Frequency 60-119 8 120-179 24 180-239 15 240-299 3 300-359 6 O Yes. The data values in each class are spread evenly across the full length of the class. O Yes. The data values in each class are equal to the corresponding class midpoint. No. The data values in each class could take on any value between the class limits, inclusive. O No. The frequency distribution tells nothing about the data values that fall below the lowest class limit or above the highest class limit
Step by Step Solution
There are 3 Steps involved in it

Get step-by-step solutions from verified subject matter experts