

Question: Identifying the center. Ms. Perry asked her 23 students how many books each had read last summer. The smallest Summary values response was 10 books,
Identifying the center.
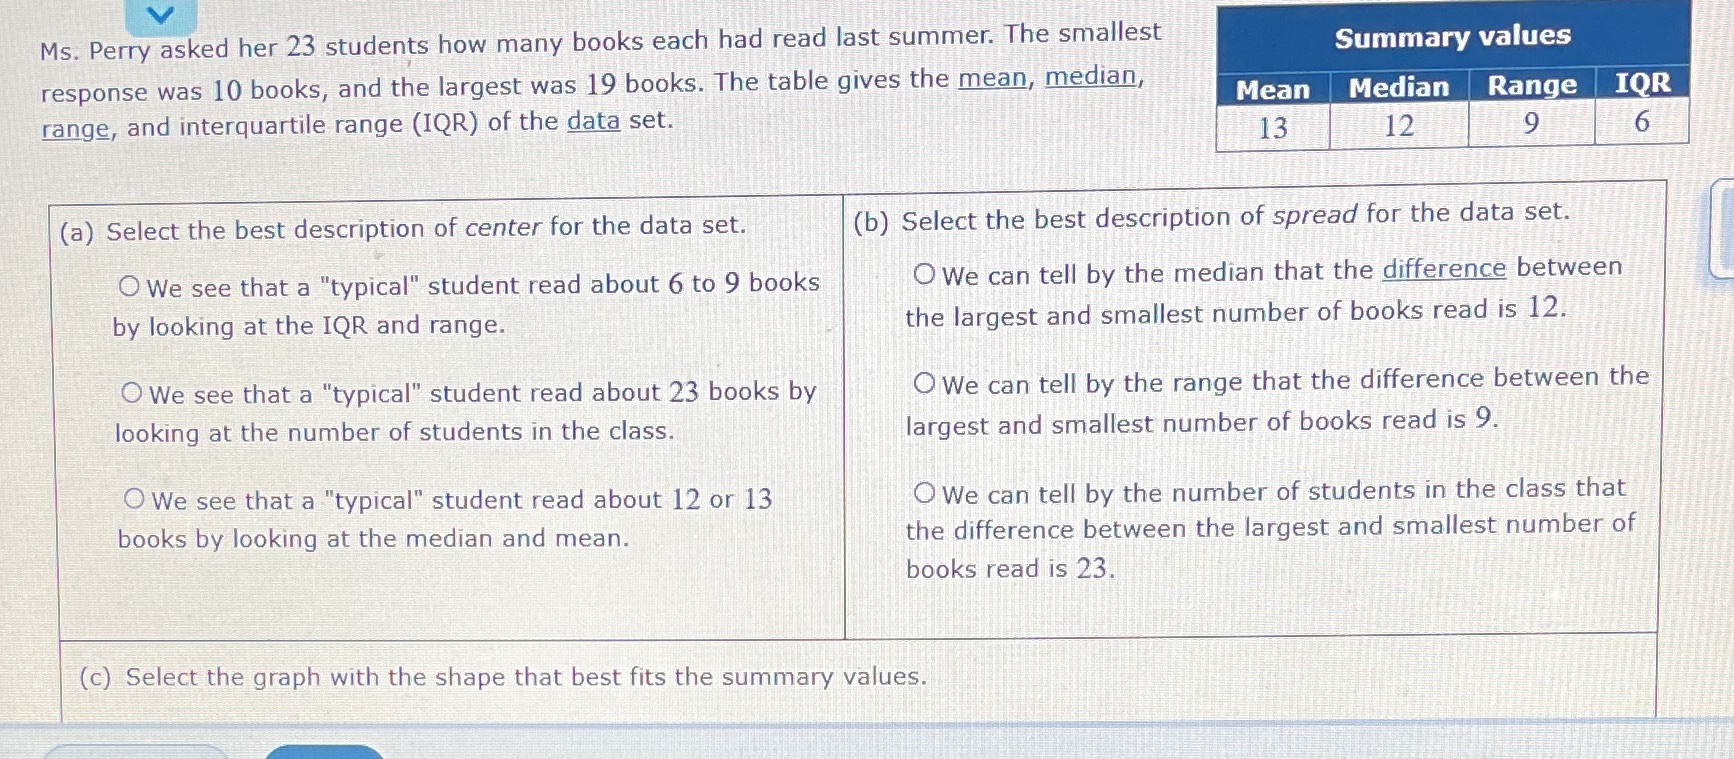
Ms. Perry asked her 23 students how many books each had read last summer. The smallest Summary values response was 10 books, and the largest was 19 books. The table gives the mean, median, Mean Median Range IOR range, and interquartile range (IQR) of the data set. 13 12 9 6 (a) Select the best description of center for the data set. (b) Select the best description of spread for the data set. We see that a "typical" student read about 6 to 9 books O We can tell by the median that the difference between by looking at the IQR and range. the largest and smallest number of books read is 12. We see that a "typical" student read about 23 books by O We can tell by the range that the difference between the looking at the number of students in the class. largest and smallest number of books read is 9. O We see that a "typical" student read about 12 or 13 O We can tell by the number of students in the class that books by looking at the median and mean. the difference between the largest and smallest number of books read is 23. (c) Select the graph with the shape that best fits the summary values
Step by Step Solution
There are 3 Steps involved in it

Get step-by-step solutions from verified subject matter experts