

Question: how do I solve ? Mr. Torres asked his 25 students how many books each had read last summer. The smallest _ _ Summary values
how do I solve ?
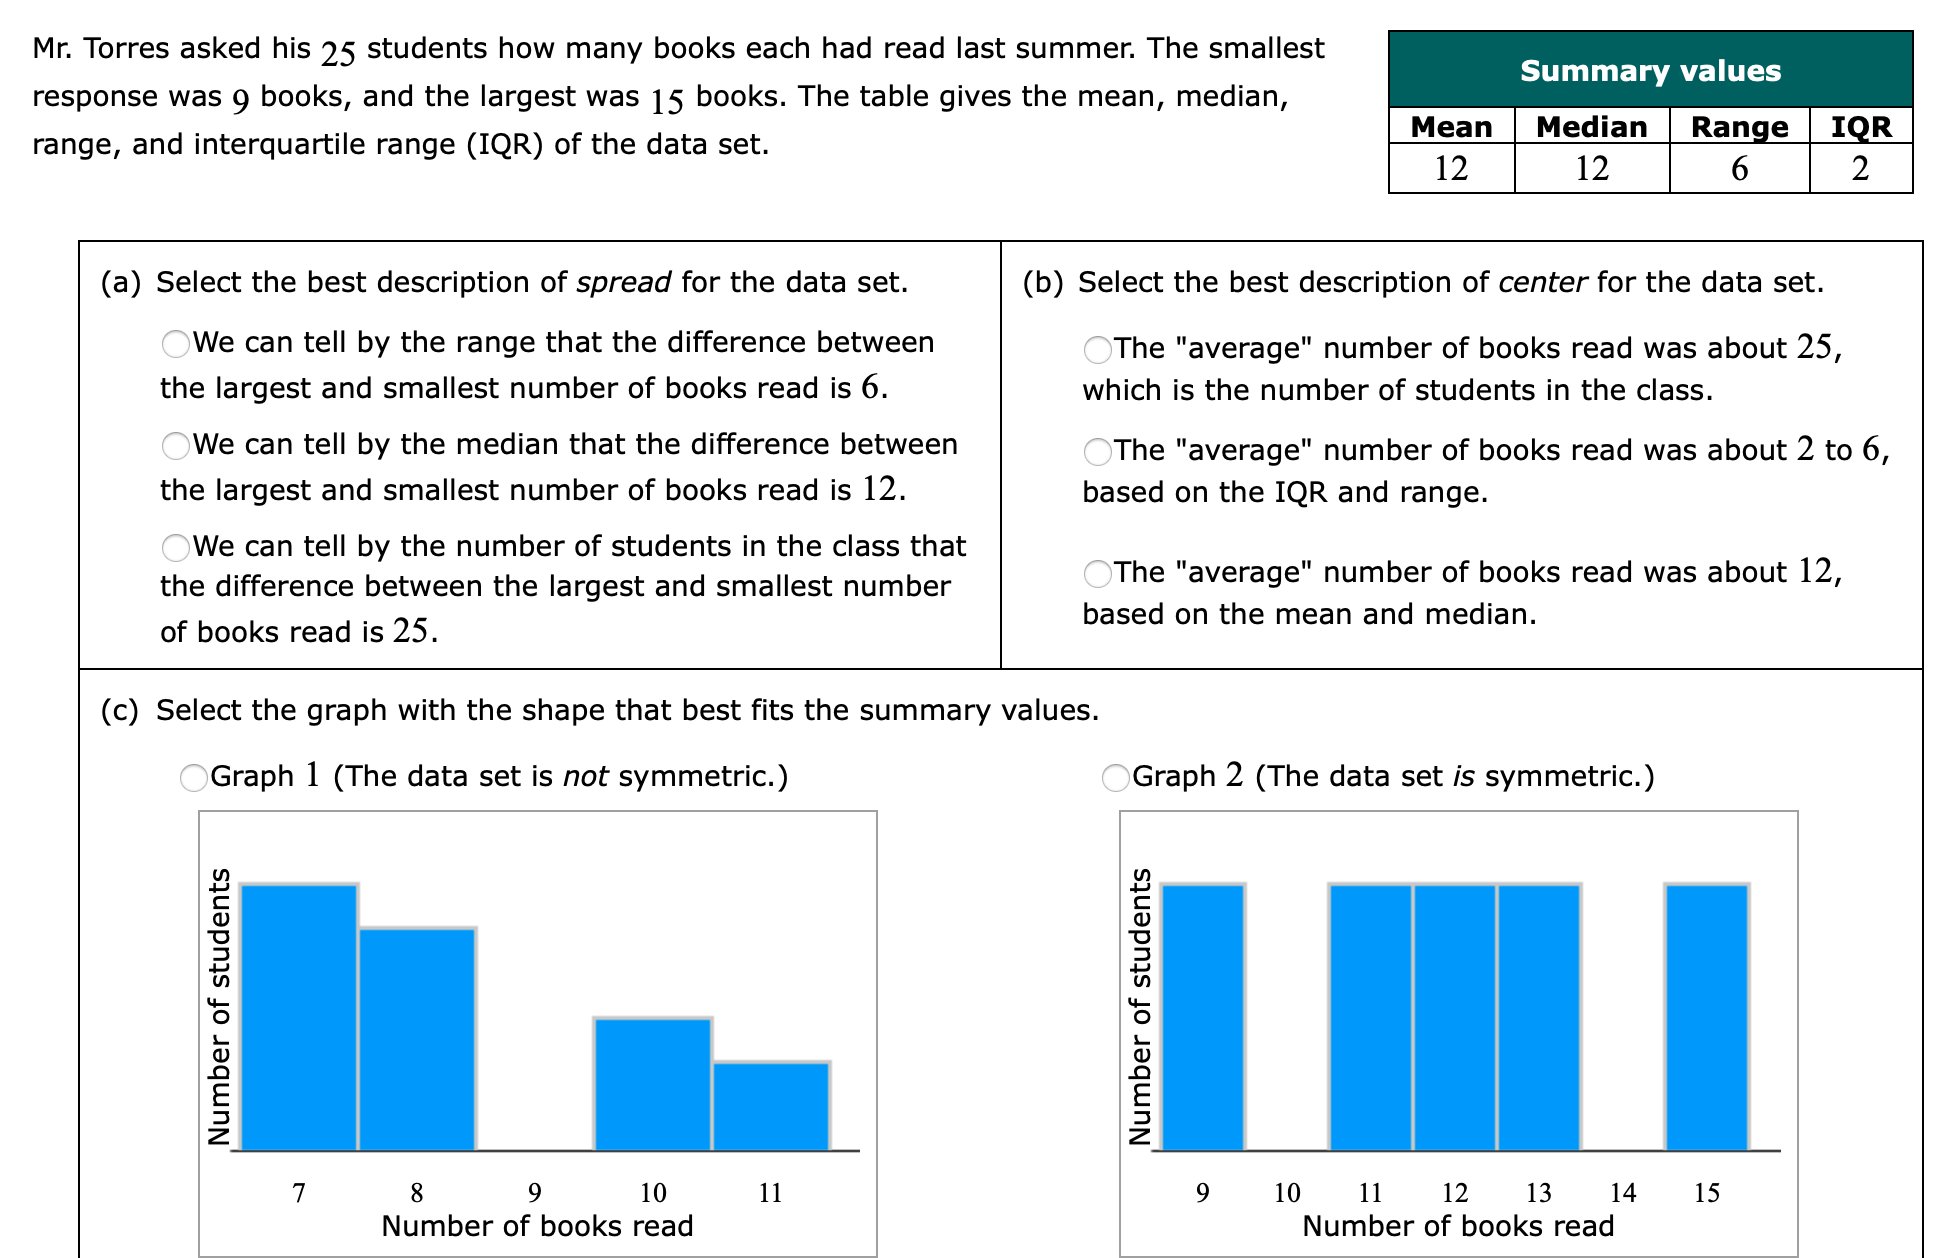
Mr. Torres asked his 25 students how many books each had read last summer. The smallest _ _ Summary values response was 9 books, and the largest was 15 books. The table glves the mean, medlan, mmmm 12 12 6 2 range, and interquartile range (IQR) of the data set. (a) Select the best description of spread for the data set. (b) Select the best description of center for the data set. OWe can tell by the range that the difference between the largest and smallest number of books read is 6. OThe "average" number of books read was about 25, which is the number of students in the class. QWe can tell by the median that the difference between the largest and smallest number of books read is 12. OThe "average" number of books read was about 2 to 6, based on the IQR and range. OWe can tell by the number of students in the class that the difference between the largest and smallest number of books read is 25. OThe "average" number of books read was about 12, based on the mean and median. (c) Select the graph with the shape that best fits the summary values. C-Graph 1 (The data set is not symmetric.) OGraph 2 (The data set is symmetric.) 3 E E a: a: 'U 'U B 3 III In \" O O L L U U .D .D E E 3 3 z z 7 8 9 10 11 9 10 11 12 13 14 15 Number of books read Number of books read
Step by Step Solution
There are 3 Steps involved in it

Get step-by-step solutions from verified subject matter experts