

Question: ider the data contained in the table below, which lists 30 monthly excess returns to two different actively managed stock portfolios A and B) and
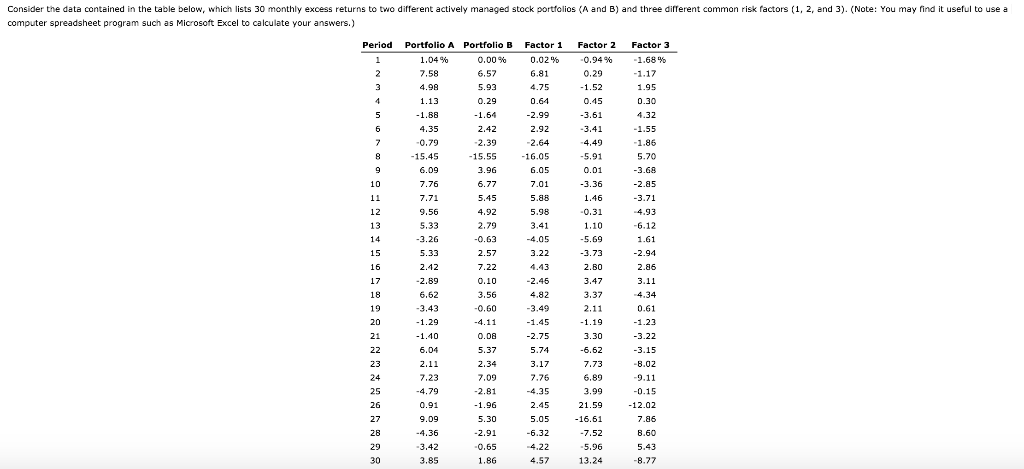
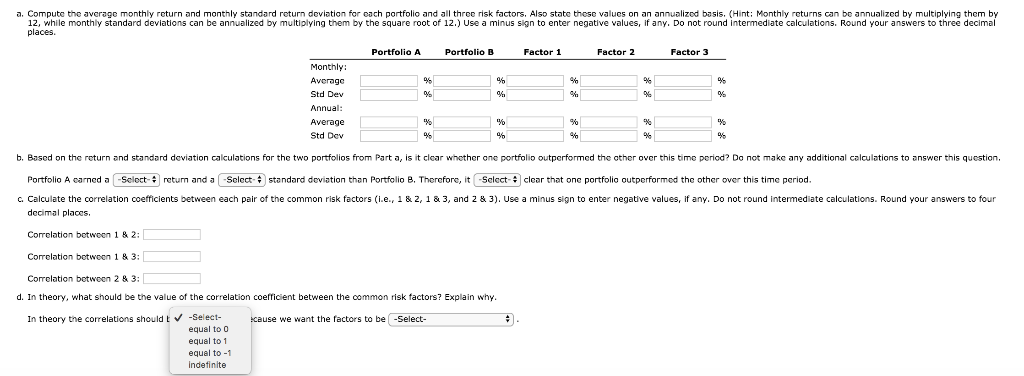
ider the data contained in the table below, which lists 30 monthly excess returns to two different actively managed stock portfolios A and B) and three different common risk factors 1, 2, and 3). (Note: You may find it useful to computer spreadsheet program such as Microsoft Excel to calculate your answers.) Period Portfolio A Portfolio B Factor 1 Factor 2 Factor 3 -0.94% 0.29 1.52 1.04 % 0.00% 6.57 5.93 0.29 0.02 % 6.81 4.75 1 .68 % 1.17 1.95 4.98 1.13 4.32 4.35 0,79 15.45 6.09 2.39 15.55 2.64 16.05 6.05 7.01 5.88 1.86 5.70 -5.91 0.01 6.77 7.71 9.56 5.33 3.26 4.92 2.79 -0.63 2.57 12 0.31 4.93 6.12 1.61 -4.05 -5.69 3.73 3.22 2.12 6.62 3.43 1.29 1.10 6.04 4.82 3.49 4.34 0.61 1.23 3.22 3.56 -0.60 3.37 2.75 5.74 -6.62 7.73 6.89 3.99 21.59 16.61 7.52 5.96 13.24 23 2.34 7,09 2.81 8.02 7,23 -4.79 0.91 9.09 -4.36 7.76 4.35 -0.15 12.02 7.86 8.60 5.43 8.77 26 28 29 30 2.91 0,65 1.86 5.05 6.32 4.22 4.57 3.85 a. Com pute the average monthly return and monthly standard return deviation for each portfolio and all three risk factors. Also state these values on an annualized basis. Hint: Monthly returns can be nnualized by multiplying them by 12, while monthly standard deviations can be annualized by multiplying them by the square root of 12.) Use a minus sign to enter negative values, if any. Do not round intermediate calculations. Round your answers to three decimal Portfolio A Portfolio B Factor 1 Factor 2 Factor 3 46 Std Dev Annual b. Based on the roturn and standard deviation calculations for the two portfolios from Part a, is it clcar whether one portfolio outperformed the other over this time period? Do not makc any additional calculations to answer this question Portfolio A earned a Select- retum and -Select standard de tion than Port olio B. Therefore, it Select: clear that one portfolio outperformed the other over this time period. c. Calculate the correlation coefficients between each pair of the common risk factorsi.e., 1 & 2, 1 &3, and 2 & 3). Use a minus sign to enter negative values, if any. Do not round intermediate calculations. Round your answers to four decimal places. Correlation botwoen 1 & 2 Correlation botwoen 1 & 3 Correlation botwoen 2 & 3 d. In theory, what should be the value of the correlation coecent between the common risk factors? Explain why In theory the correlations should t Selet- we want the factors to be-Select equal to 0 equal to 1 equal to-1 indefinite ider the data contained in the table below, which lists 30 monthly excess returns to two different actively managed stock portfolios A and B) and three different common risk factors 1, 2, and 3). (Note: You may find it useful to computer spreadsheet program such as Microsoft Excel to calculate your answers.) Period Portfolio A Portfolio B Factor 1 Factor 2 Factor 3 -0.94% 0.29 1.52 1.04 % 0.00% 6.57 5.93 0.29 0.02 % 6.81 4.75 1 .68 % 1.17 1.95 4.98 1.13 4.32 4.35 0,79 15.45 6.09 2.39 15.55 2.64 16.05 6.05 7.01 5.88 1.86 5.70 -5.91 0.01 6.77 7.71 9.56 5.33 3.26 4.92 2.79 -0.63 2.57 12 0.31 4.93 6.12 1.61 -4.05 -5.69 3.73 3.22 2.12 6.62 3.43 1.29 1.10 6.04 4.82 3.49 4.34 0.61 1.23 3.22 3.56 -0.60 3.37 2.75 5.74 -6.62 7.73 6.89 3.99 21.59 16.61 7.52 5.96 13.24 23 2.34 7,09 2.81 8.02 7,23 -4.79 0.91 9.09 -4.36 7.76 4.35 -0.15 12.02 7.86 8.60 5.43 8.77 26 28 29 30 2.91 0,65 1.86 5.05 6.32 4.22 4.57 3.85 a. Com pute the average monthly return and monthly standard return deviation for each portfolio and all three risk factors. Also state these values on an annualized basis. Hint: Monthly returns can be nnualized by multiplying them by 12, while monthly standard deviations can be annualized by multiplying them by the square root of 12.) Use a minus sign to enter negative values, if any. Do not round intermediate calculations. Round your answers to three decimal Portfolio A Portfolio B Factor 1 Factor 2 Factor 3 46 Std Dev Annual b. Based on the roturn and standard deviation calculations for the two portfolios from Part a, is it clcar whether one portfolio outperformed the other over this time period? Do not makc any additional calculations to answer this question Portfolio A earned a Select- retum and -Select standard de tion than Port olio B. Therefore, it Select: clear that one portfolio outperformed the other over this time period. c. Calculate the correlation coefficients between each pair of the common risk factorsi.e., 1 & 2, 1 &3, and 2 & 3). Use a minus sign to enter negative values, if any. Do not round intermediate calculations. Round your answers to four decimal places. Correlation botwoen 1 & 2 Correlation botwoen 1 & 3 Correlation botwoen 2 & 3 d. In theory, what should be the value of the correlation coecent between the common risk factors? Explain why In theory the correlations should t Selet- we want the factors to be-Select equal to 0 equal to 1 equal to-1 indefinite
Step by Step Solution
There are 3 Steps involved in it

Get step-by-step solutions from verified subject matter experts