

Question: iey9 StuCyTEXTBOOR SOLUTIONS EXPERT Q&A home / study / engineering / computer science / computer scence questions and answers / in this e-project. you willexplore
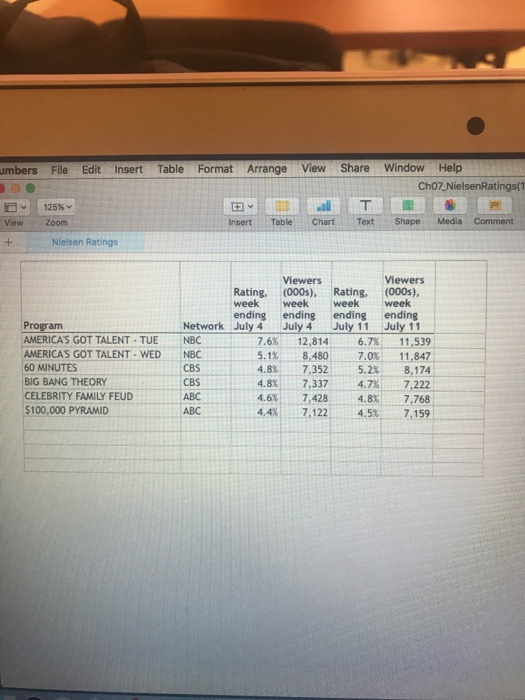
iey9 StuCyTEXTBOOR SOLUTIONS EXPERT Q&A home / study / engineering / computer science / computer scence questions and answers / in this e-project. you willexplore tv rat / study /engineering/computer science/ computer sience questions and answers/in Question: In this e-project, you will explore V ratings and analyze In this e-project, you will explore TV ratings and analyze them with Excel. Download the Excel file called Ch07_NielsenRatings. This file contains ratings for popular network programs for two separate weeks in 2013. (http://www.nielsen.com/us/en/top10s.html). The rating represents the percent of US. households that were watching that channel at the time (of those whose TV was turned on). 7-34. Calculate three new columns. Percent change (up or down) in number of viewers from the July 4 data to the July 11 data for each show. Percent change (up or down) in rating for each show. Absolute change irn the number of viewers for each show this is it View comments Expert
Step by Step Solution
There are 3 Steps involved in it

Get step-by-step solutions from verified subject matter experts