

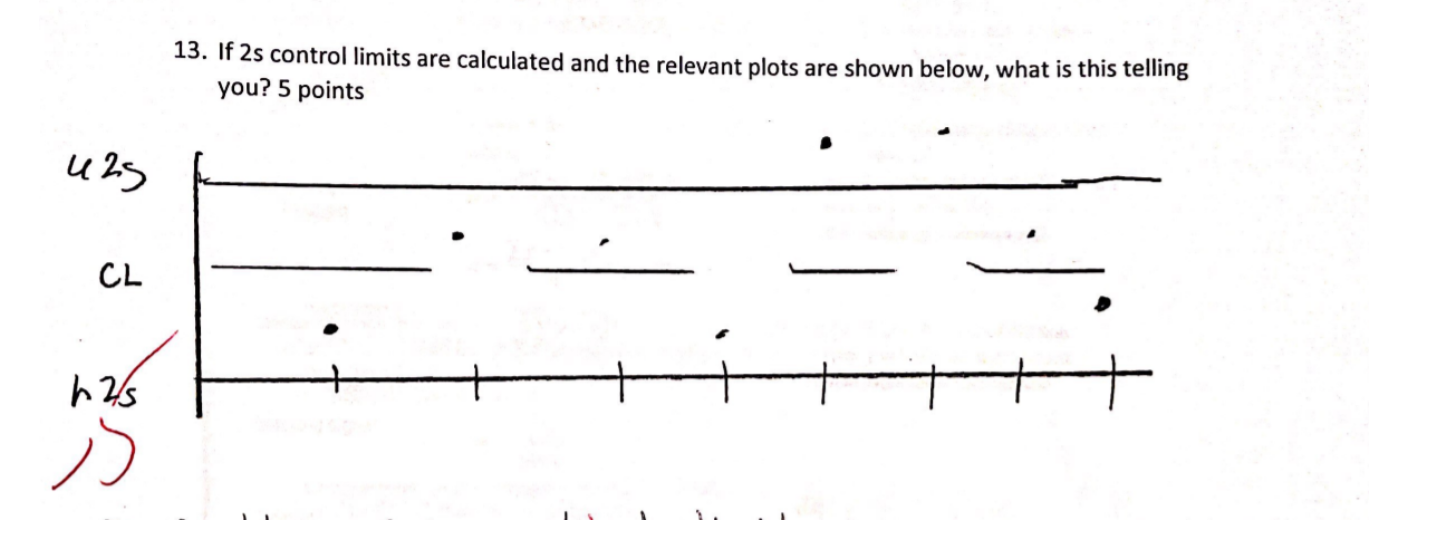
Question: If 2s control limits are calculated and the relevant plots are shown below, what is this telling you? Please write a paragraph explaining the answer
If 2s control limits are calculated and the relevant plots are shown below, what is this telling you?
Please write a paragraph explaining the answer as thoroughly as you can, and also explain what the dots in the graph mean.
Step by Step Solution
There are 3 Steps involved in it
1 Expert Approved Answer
Step: 1 Unlock

Question Has Been Solved by an Expert!
Get step-by-step solutions from verified subject matter experts
Step: 2 Unlock
Step: 3 Unlock