

Question: **IF ANY INFORMATION IS MISSING PLEASE LET ME KNOW AND I WILL PROVIDE!** Valuation of Dillards Company: You have been hired as new analyst at
**IF ANY INFORMATION IS MISSING PLEASE LET ME KNOW AND I WILL PROVIDE!**
Valuation of Dillards Company:You have been hired as new analyst at Financial Services and have been asked to demonstrate your finance skills that you learned in the college. You have been assigned to James Thomas who is one of the top portfolio managers of the company. Your first assignment is to analysis Dillards department stores and recommend a buy/or sell price to Thomas. To value the company, you decided to use the two widely valuation models that you learned in your classes- discounted free cash flows and relative valuation based on comparable companies. However, you remembered that your instructor had told the class that these two valuation methods would result in widely different prices.
| 10 year bond %(risk free rate) | 0.729 |
| Market Cap | 809.61M |
| Enterprise Value | 1.15B |
| Beta | 1.34 |
| Profit Margin | 1.75% |
| ROA | 2.91% |
| ROE | 6.73% |
| Revenue | 6.34B |
| Revenue per share | 250.09% |
| Gross Profit | 2.11B |
| EBITDA | 383.19M |
| Net Income | 111.08M |
| Total Cash | 277.08M |
| Cash Per Share | 11.85 |
| Total Debt | 37.88 |
| Current Ratio | 1.99 |
| BV per share | 67.09 |
| OCF | 365.07M |
| Levered Free cash flow | 252.41M |
| Float | 7.66M |
| TTM | 2020 | 2019 | 2018 | |
| Total Revenue | 6,343,211 | 6,343,211 | 6,503,349 | 6,503,349 |
| Cost of Revenue | 4,235,978 | 4,235,978 | 4,291,520 | 4,199,718 |
| Gross Profit | 2,107,233 | 2,107,233 | 2,211,829 | 2,222,958 |
| Operating Expenses | ||||
| Selling General and Administrative | 1,717,392 | 1,717,392 | 1,719,826 | 1,720,157 |
| Total Operating Expenses | 1,939,741 | 1,939,741 | 1,943,641 | 1,951,752 |
| Operating Income or Loss | 167,492 | 167,492 | 268,188 | 271,206 |
| Interest Expense | 46,541 | 46,541 | 52,571 | 62,096 |
| Total Other Income/Expenses Net | 12,626 | 12,626 | -7,708 | 4,063 |
| Income Before Tax | 133,891 | 133,891 | 207,962 | 212,689 |
| Income Tax Expense | 22,810 | 22,810 | 37,730 | -7,800 |
| Income from Continuing Operations | 111,081 | 111,081 | 170,263 | 221,324 |
| Net Income | 111,081 | 111,081 | 170,263 | 221,324 |
| Net Income available to common shareholders | 111,081 | 111,081 | 170,263 | 221,324 |
| Basic EPS | 4.38 | 6.23 | 7.51 | |
| Diluted EPS | 4.38 | 6.23 | 7.51 | |
| Basic Average Shares | 25,364 | 27,300 | 29,500 | |
| Diluted Average Shares | 25,364 | 27,300 | 29,500 | |
| EBITDA | 404,741 | 486,382 | 508,468 |
Section 1-Discounted Cash flow Valuation: To value the stock using discounted cash flow model estimate the last three-year averages of the following ratios:
EBIT/Sales
Tax Rate Property and Equipment
Depreciation as a percent of property and equipment
Net Working Capital
Forecast future sales for the next five years. Using the forecasted sales estimate, the ratios of section-1 for the next five years.
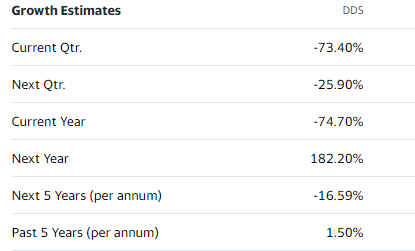
Growth Estimates DDS Current Qtr. -73.40% Next Qtr. -25.90% Current Year -74.70% Next Year 182.20% Next 5 Years (per annum) -16.59% Past 5 Years (per annum) 1.50% Growth Estimates DDS Current Qtr. -73.40% Next Qtr. -25.90% Current Year -74.70% Next Year 182.20% Next 5 Years (per annum) -16.59% Past 5 Years (per annum) 1.50%
Step by Step Solution
There are 3 Steps involved in it

Get step-by-step solutions from verified subject matter experts