

Question: If consensus analyst stock price forecast one year is $75, what is the estimated stock price if you buy and hold Wal-Mart stock for one
If consensus analyst stock price forecast one year is $75, what is the estimated stock price if you buy and hold Wal-Mart stock for one year?
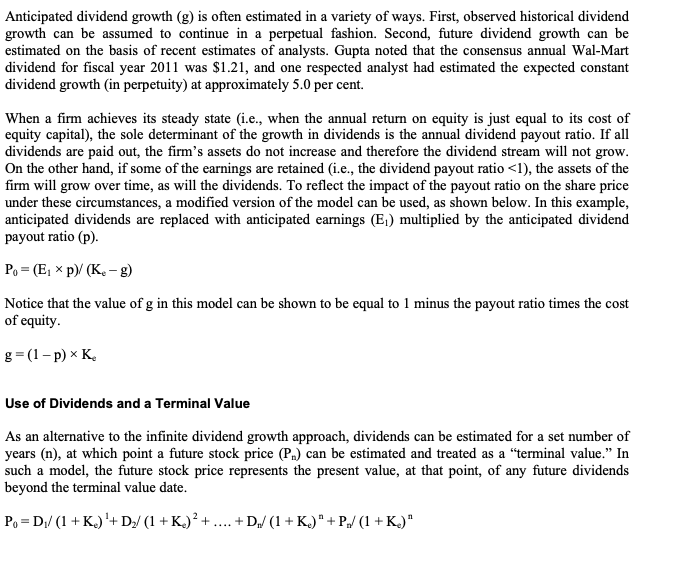
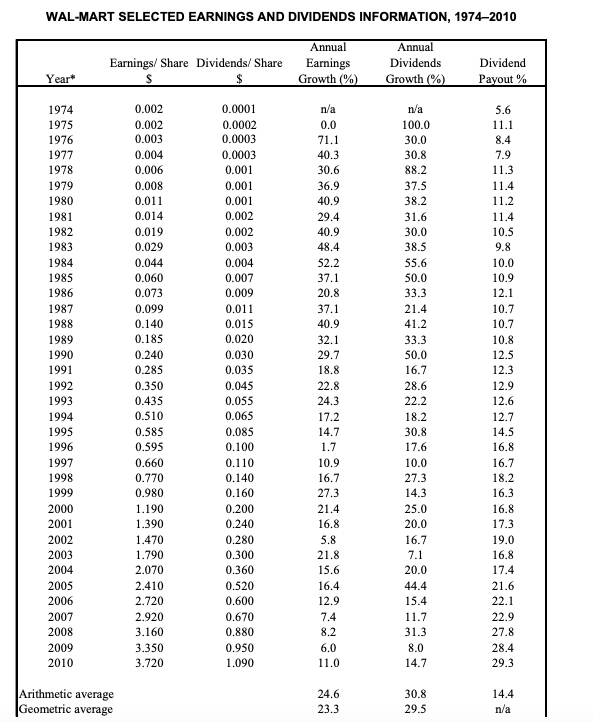
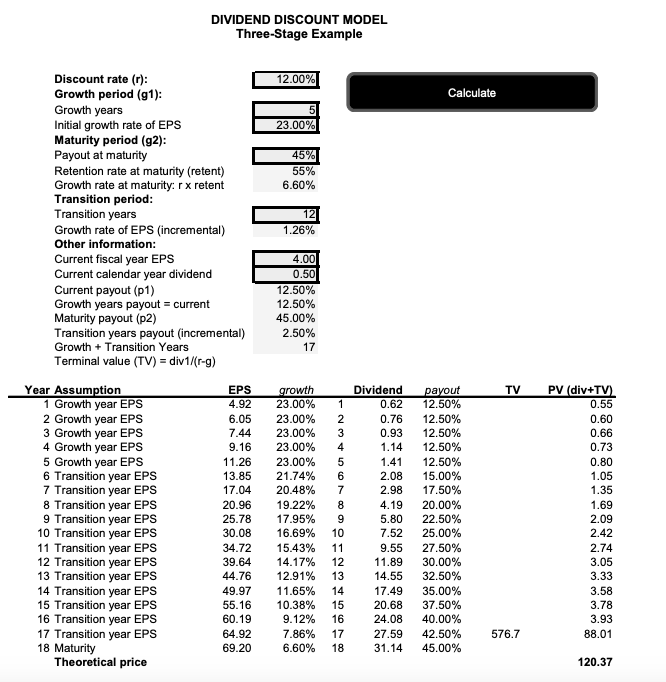
stock splits). It had undergone 11 two-for-one stock splits, and thus, an original lot of 100 Wal-Mart shares had grown to 204,800 shares after the most recent split in April 1999. Analysts generally believed that Wal-Mart would continue to be successful in consistently increasing profits, resulting in the consensus annual earnings growth forecast of 10.40 per cent for the next five years. As of February 2010, according to Bloomberg L. P., Wal-Mart shares were ranked as "buys in the coming six to 12 months by 20 analysts, "holds" by 7 analysts and "sells by none of the analysts. These rankings (which amounted to an average of 4.41 on a five-point scale) currently exceeded the average buy/hold/sell mix among Standard & Poor (S&P) 500 firms (at 3.94) and among the hypermarkets and supercenters sub- industry (at 4.23). Analysts' consensus projected Wal-Mart's target price was $60.50 per share, relative to a recent closing price of $53.48 per share. Over the 2010 fiscal year, Wal-Mart shareholders had generated a total return (including dividends) of 9.69 per cent, and the consensus stock price forecast ranking (as measured by buys/holds/sells) was above that of the overall market. Wal-Mart's 52-week high stock price was $55.01 per share and the 52-week low was $46.42 per share. Gupta noticed that Wal-Mart shares had a price-to-trailing earnings (P/E) ratio of 14.40 times (based on the last four quarters of earnings) and an indicated dividend yield (based on the current 2010 quarterly dividend and current stock price) of 2.0 per cent. Exhibit 2 presents a graph of Wal-Mart's stock price for 10 years, and Exhibit 3 provides historical dividend data. In determining whether Wal-Mart was fairly valued, Gupta decided to focus on valuation concepts she had been introduced to in her university business courses and in one of her firm's training courses: the dividend discount model, the capital asset pricing model (CAPM) and price/earnings multiples. DIVIDEND DISCOUNT MODELS Dividends in Perpetuity According to the dividend discount model (DDM), the current stock price of Wal-Mart represents the present value of all expected future dividends, discounted at an investor's required (or expected) rate of return. Under this approach, a share is valued by forecasting dividends in perpetuity, which is not an easy task. To simplify the daunting task of estimating all future dividends, a growth trend of the dividends can be used in a much simpler version of the model, which is known as the constant growth dividend discount model. According to the constant growth DDM, the current value of a firm's stock price (P.) is equal to next year's (expected) dividend (D) divided by an investor's required rate of return (K.) minus the expected perpetual dividend growth rate (g). Anticipated dividend growth (g) is often estimated in a variety of ways. First, observed historical dividend growth can be assumed to continue in a perpetual fashion. Second, future dividend growth can be estimated on the basis of recent estimates of analysts. Gupta noted that the consensus annual Wal-Mart dividend for fiscal year 2011 was $1.21, and one respected analyst had estimated the expected constant dividend growth in perpetuity) at approximately 5.0 per cent. When a firm achieves its steady state (i.e., when the annual return on equity is just equal to its cost of equity capital), the sole determinant of the growth in dividends is the annual dividend payout ratio. If all dividends are paid out, the firm's assets do not increase and therefore the dividend stream will not grow. On the other hand, if some of the earnings are retained (i.e., the dividend payout ratio
Step by Step Solution
There are 3 Steps involved in it

Get step-by-step solutions from verified subject matter experts